1 Apr, 2024
Insights, stories, trends, case studies.
To give you a better understanding of the
EXIM business landscape.


The Surge in Chinese Steel Exports Sparks Concerns and Trade Tensions
1 Apr, 2024
In recent years, the global steel industry has witnessed a significant uptick in Chinese steel exports, raising concerns among steel-producing nations and triggering trade tensions on the international stage. As China solidifies its position as the world's largest steel producer, the ramifications of its export-driven strategy reverberate across markets and economies worldwide. This article delves into the growth of Chinese steel exports, examines its implications for the steel trade, and explores the resulting trade tensions and challenges.
Understanding the Rise in Chinese Steel Exports
China's steel industry has experienced exponential growth over the past few decades, fueled by robust domestic demand, government stimulus measures, and substantial investments in infrastructure and construction projects. As a result, China has emerged as the leading producer and consumer of steel globally, accounting for a significant share of the world's steel output.
However, China's steel production capacity far exceeds domestic demand, leading to an oversupply scenario. To alleviate domestic pressure and sustain its steel industry's growth momentum, China has increasingly turned to the export market, flooding global markets with competitively priced steel products.

Key Factors Driving Chinese Steel Exports:
- Excess Production Capacity: China's steel industry boasts substantial production capacity, supported by state-of-the-art facilities and economies of scale. The surplus capacity enables China to produce vast quantities of steel, surpassing domestic demand and necessitating export avenues to absorb the excess output.
- Competitive Pricing: Chinese steel exporters benefit from lower production costs, owing to factors such as abundant raw materials, economies of scale, and government subsidies. This cost advantage allows Chinese steel products to be competitively priced in international markets, often undercutting domestic producers in other countries.
- Global Demand Dynamics: Despite concerns about quality and environmental standards, Chinese steel exports continue to find eager buyers in regions with high demand for steel, such as Southeast Asia, Africa, and Latin America. Infrastructure development, urbanization, and industrialization projects drive demand for steel products, creating lucrative export opportunities for Chinese manufacturers.
- Trade Policies and Subsidies: China's trade policies and subsidies play a significant role in facilitating steel exports. Government support, including financial incentives, tax rebates, and export credits, bolster the competitiveness of Chinese steel products in the global market, enabling exporters to maintain market share and expand their reach.
Implications of Chinese Steel Exports on the Global Steel Trade
The surge in Chinese steel exports carries multifaceted implications for the global steel trade, affecting steel-producing nations, downstream industries, and international trade dynamics.
- Impact on Domestic Steel Producers: The influx of Chinese steel exports poses a formidable challenge to domestic steel producers in other countries. Unfair competition from low-priced Chinese imports can erode market share, depress prices, and undermine the viability of domestic steel industries, leading to job losses and industry consolidation.
- Quality and Safety Concerns: Chinese steel exports have been subject to scrutiny and criticism regarding quality, safety, and adherence to international standards. Instances of substandard and counterfeit steel products raise concerns about product reliability, performance, and safety, prompting calls for stricter quality control measures and regulatory oversight.
- Trade Imbalances and Protectionism: The surge in Chinese steel exports exacerbates trade imbalances and triggers protectionist sentiments in importing countries. Concerns about unfair trade practices, including dumping, subsidies, and currency manipulation, prompt calls for trade remedies such as tariffs, quotas, and anti-dumping duties to safeguard domestic industries and address trade distortions.
- Global Overcapacity and Price Volatility: China's export-driven strategy contributes to global steel overcapacity, exacerbating price volatility and market instability. Excessive steel production and exports exert downward pressure on global steel prices, impacting profitability and investment decisions across the steel value chain.
Addressing Trade Tensions and Challenges
Addressing the challenges posed by the surge in Chinese steel exports requires collaborative efforts and proactive measures at the national and international levels. Key strategies include:
- Multilateral Dialogue and Cooperation: Engaging in constructive dialogue and cooperation through international forums such as the World Trade Organization (WTO) facilitates discussions on trade issues, promotes transparency, and seeks consensus-based solutions to address global steel overcapacity and trade distortions.
- Enforcement of Trade Remedies: Implementing and enforcing trade remedies, including anti-dumping measures, countervailing duties, and safeguard measures, provides a legal framework to address unfair trade practices and protect domestic industries from the adverse effects of subsidized and dumped imports.
- Quality Certification and Standards Compliance: Strengthening quality certification processes and ensuring compliance with international standards enhances the credibility and competitiveness of steel products in global markets. Promoting adherence to quality, safety, and environmental standards fosters consumer confidence and reduces the proliferation of substandard imports.
- Diversification of Export Markets: Diversifying export markets and reducing reliance on a single market or region helps mitigate risks associated with market fluctuations and trade disruptions. Exploring emerging markets, investing in market research, and cultivating strategic partnerships enhance market resilience and facilitate sustainable export growth.

The growth of Chinese steel exports presents both opportunities and challenges for the global steel industry and international trade. While Chinese steel products contribute to infrastructure development and economic growth in importing countries, they also pose significant competitive pressures and trade tensions for domestic steel producers worldwide. Addressing the complexities of global trade and trade data requires concerted efforts to promote fair competition, uphold quality standards, and foster a level playing field for all stakeholders. By embracing dialogue, cooperation, and proactive measures, the steel industry can navigate the challenges posed by Chinese steel exports and foster a more sustainable and balanced global trade environment.
FAQs:
Q1. What are the main concerns associated with the surge in Chinese steel exports?
Ans: The surge in Chinese steel exports raises concerns about unfair competition, market distortions, job losses in domestic industries, quality and safety issues, and trade tensions among steel-producing nations.
Q2. How do Chinese steel exports affect domestic steel industries in other countries?
Ans: Chinese steel exports can undercut domestic steel producers in other countries by offering lower-priced products, leading to decreased market share, depressed prices, and potential industry consolidation or closures.
Q3. What measures can be taken to address the challenges posed by Chinese steel exports?
Ans: Strategies to address the challenges include enforcing trade remedies, promoting quality certification and standards compliance, diversifying export markets, and engaging in multilateral dialogue and cooperation to address global steel overcapacity and trade imbalances.
Q4. What role do trade policies and subsidies play in facilitating Chinese steel exports?
Ans: Trade policies and subsidies, including financial incentives, tax rebates, and export credits, bolster the competitiveness of Chinese steel products in the global market, enabling exporters to maintain market share and expand their reach.
Q5. How can countries balance the benefits of Chinese steel imports with the need to protect domestic industries?
Ans: Countries can balance the benefits of Chinese steel imports with the need to protect domestic industries by implementing trade remedies, promoting fair competition, strengthening quality standards, and diversifying export markets to reduce reliance on a single source of imports.

Exporting Indias Finest Brew: A Comprehensive Guide to Tea Export from India
29 Mar, 2024
0
India, renowned for its rich cultural heritage and diverse flavors, stands as a prominent player in the global tea market. With a long-standing tradition of tea cultivation and production, the country offers a wide array of exquisite teas that captivate palates worldwide. This article serves as a comprehensive guide to exporting tea from India to other countries, exploring the best practices, opportunities, and insights into the thriving Indian tea industry.
The Significance of Indian Tea
India boasts a proud legacy in the tea industry, producing some of the world's finest teas renowned for their unique flavors, aroma, and quality. From the robust Assam teas to the delicate Darjeeling varieties, Indian tea holds a special place in the hearts of tea enthusiasts globally. The diverse geography and climate of India's tea-growing regions contribute to the distinct characteristics of each tea, making them highly sought after in international markets.

Exploring the Best Tea Regions in India
1. Assam: Known for its bold and malty flavors, Assam produces robust black teas favored for their strength and richness. The fertile plains of the Brahmaputra Valley nurture the Assam tea bushes, yielding teas prized for their deep coppery hue and brisk character.
2. Darjeeling: Nestled in the foothills of the Himalayas, Darjeeling is celebrated for its exquisite and aromatic teas. Often referred to as the "Champagne of Teas," Darjeeling teas offer delicate floral notes and a muscatel flavor profile that distinguishes them as a connoisseur's choice.
3. Nilgiris: Situated in the picturesque Nilgiri hills of southern India, this region produces teas known for their smoothness, briskness, and bright liquor. Nilgiri teas are prized for their versatility, making them ideal for blending and complementing a range of flavors.
4. Kangra: Located in the serene Kangra Valley of Himachal Pradesh, this lesser-known tea region produces teas with a unique character and complexity. Kangra teas are celebrated for their floral aroma, subtle sweetness, and distinctive muscatel flavor.
Exporting Indian Tea: Key Considerations
- Quality Assurance: To maintain India's reputation for producing high-quality teas, exporters must prioritize stringent quality control measures at every stage of production, processing, and packaging. Adhering to international quality standards and certifications enhances the marketability and credibility of Indian teas in foreign markets.
- Market Research: Conducting thorough market research is essential to identify target markets, understand consumer preferences, and assess competition. Analyzing trends, demand patterns, and regulatory requirements enables exporters to tailor their offerings and strategies to meet the specific needs of each market.
- Regulatory Compliance: Exporting tea from India entails compliance with various regulations and standards governing food safety, labeling, and packaging in destination countries. Exporters must ensure adherence to regulatory requirements, obtain necessary certifications, and provide accurate documentation to facilitate customs clearance and market access.
- Packaging and Branding: Packaging plays a pivotal role in influencing consumer perception and purchase decisions. Exporters should invest in attractive, durable packaging that preserves the freshness and integrity of Indian teas while reflecting the brand's identity and values. Innovative packaging designs and branding strategies can enhance product visibility and appeal in competitive markets.
Seizing Opportunities in the Global Tea Trade
- Diversification of Product Portfolio: Indian tea exporters can leverage the country's diverse tea-growing regions to offer a wide range of specialty teas catering to evolving consumer preferences. From organic and single-origin teas to flavored and herbal blends, diversifying the product portfolio enables exporters to target niche markets and differentiate their offerings.
- E-commerce Platforms: The growing popularity of e-commerce platforms presents lucrative opportunities for Indian tea exporters to reach a global audience directly. Establishing an online presence and leveraging digital marketing channels facilitate accessibility, engagement, and sales growth in the competitive online marketplace.
- Participation in Trade Fairs and Exhibitions: Participating in international trade fairs and exhibitions provides Indian tea exporters with a platform to showcase their products, network with industry stakeholders, and explore potential collaborations and partnerships. These events serve as valuable opportunities to gain market insights, forge new business connections, and expand market reach.
Conclusion
Exporting tea from India to other countries offers immense opportunities for growth and expansion in the global tea market. With its rich heritage, diverse tea offerings, and commitment to quality, India stands poised to captivate tea enthusiasts worldwide. By adhering to best practices, conducting thorough market research, and embracing innovation, Indian tea exporters can unlock the full potential of the country's tea industry and establish a formidable presence on the international stage.
As India continues to assert its position as a leading tea exporter, the journey from leaf to cup embodies a timeless tradition infused with passion, craftsmanship, and a commitment to excellence.

Exporting tea from India presents a world of opportunities for growth and success in global trade and trade data. With its rich heritage, diverse offerings, and unwavering commitment to quality, India continues to leave an indelible mark on the global tea industry, one cup at a time.
FAQs:
Q1. What makes Indian tea unique compared to teas from other regions?
Ans: Indian tea is renowned for its diverse flavors, aroma, and quality, attributed to the country's unique geography, climate, and cultivation practices. Each tea-growing region in India offers distinct varieties, ranging from robust Assam teas to delicate Darjeeling blends, catering to a wide spectrum of taste preferences.
Q2. How can Indian tea exporters ensure the freshness and quality of teas during the export process?
Ans: Indian tea exporters prioritize stringent quality control measures, including careful selection of tea leaves, prompt processing, and airtight packaging to preserve freshness and flavor. Regular quality inspections and adherence to international quality standards further ensure the superior quality of Indian teas in the global market.
Q3. What are some emerging trends in the global tea market that Indian exporters should be aware of?
Ans: Emerging trends in the global tea market include the growing demand for specialty and premium teas, increased consumer interest in health and wellness teas, and the rising popularity of sustainable and ethically sourced teas. Indian exporters can capitalize on these trends by innovating their product offerings, embracing sustainability practices, and targeting niche markets.
Q4. How can Indian tea exporters navigate trade barriers and regulatory requirements in foreign markets?
Ans: Indian tea exporters must conduct thorough research on regulatory requirements, import regulations, and labeling standards in target markets. Seeking guidance from trade associations, engaging with regulatory authorities, and obtaining necessary certifications and documentation are essential steps to ensure compliance and facilitate market access.
Q5. What strategies can Indian tea exporters employ to enhance brand visibility and market presence in foreign countries?
Ans: Indian tea exporters can enhance brand visibility and market presence by leveraging digital marketing channels, participating in trade fairs and exhibitions, forging strategic partnerships with distributors and retailers, and offering personalized customer experiences. Building a strong brand identity, communicating the unique attributes of Indian teas, and delivering exceptional quality and service are key to establishing a lasting impression in foreign markets.

Effect on India Rice Export Due to Red Sea Attacks
28 Mar, 2024
0
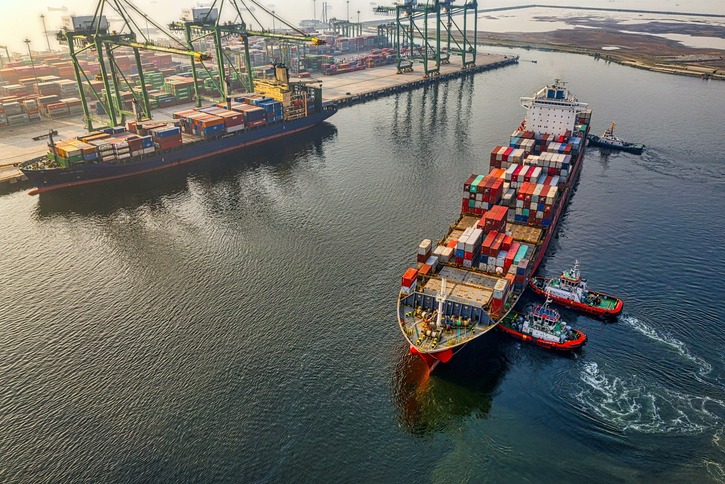
Global trade has faced unprecedented challenges in recent months, with the agricultural sector having a significant impact. Among these challenges, the attacks in the Red Sea have emerged as a critical concern, particularly for the rice world production and export industry. India, a top rice exporter, mainly basmati rice export, is at the centre of this crisis. This situation has implications for global rice shortage and world rice shortage, affecting countries worldwide that depend on India for their rice supply. This article explores the effects of these attacks on India's rice export and the broader implications for global markets.
The Impact on India's Rice Export
- The Immediate Fallout
The attacks in the Red Sea have posed significant logistical and security challenges for shipping routes crucial for rice export news. This disruption has led to delays and increased shipping costs, directly impacting basmati exports from India and other rice varieties. The immediate fallout is a decrease in India's reliability as a rice supplier, potentially leading to a global rice shortage.
- Rising Costs and Pricing Pressures
Increased shipping costs due to rerouted shipments and enhanced security measures have led to higher prices for Indian rice on the global market. This situation exacerbates the world rice shortage, making it difficult for importing countries to manage their food security concerns affordably.
Broader Implications for Global Markets
- Threat to Food Security
The global rice shortage resulting from disrupted rice world production and export channels threatens food security in many countries. Rice is a staple food for over half the world's population, and any significant disruption in its supply can have far-reaching consequences.
- Impact on Global Prices
The world rice shortage can potentially drive up rice prices globally, affecting not just the importers of Indian rice but also countries that rely on other suppliers. The interconnectedness of global markets means that price increases in one part of the world can ripple through to others, impacting global food inflation.

Overcoming Challenges
- Diversification of Supply Channels
One potential strategy to mitigate the impact of the attacks in the Red Sea is to diversify supply channels. Exploring alternative shipping routes and sources of rice can help stabilize rice export news and supply.
- Technological and Strategic Solutions
Investing in technology to improve supply chain resilience and adopting strategic stockpiling practices can also help countries better manage the risks associated with a global rice shortage.
How Do the Attacks in the Red Sea Affect Global Rice Production?
- Disruption of Supply Chains: The attacks in the Red Sea have led to significant disruptions in the shipping routes critical for rice world production, causing delays and uncertainties in the global rice supply.
- Increased Costs for Exporters: These attacks have escalated security and insurance costs for shippers, directly affecting the price of basmati rice export and other varieties from India contributing to a global rice shortage.
- Impact on Basmati Export from India: These disruptions could affect the premium market segment, specifically basmati rice export, where timely delivery and product quality are paramount.
- Alternatives and Adaptations: In response, exporters and countries might seek alternative routes or methods, potentially affecting rice export news with new agreements or diplomatic efforts to ensure security and continuity of trade.
What Are the Global Implications of a Rice Shortage?
- Food Security Concerns: A world rice shortage could exacerbate food insecurity in vulnerable regions where rice is a staple diet for millions.
- Price Volatility: Shortages typically lead to price increases, making rice less affordable for consumers worldwide and escalating the issue of global rice shortage.
- Shifts in Trade Dynamics: Countries might seek new trading partners or increase their rice world production capacities, altering the traditional rice export news landscape.
- Innovation in Agriculture: The shortage might accelerate investment in agricultural technologies to increase yield and efficiency in rice world production, aiming to mitigate future shortages.
Read more: The white staple is high in demand
How Can Stakeholders Mitigate the Impact of These Challenges?
- Diversifying Sources: Importing countries could diversify their sources of rice to reduce dependency on basmati export from India and other affected exporters.
- Strategic Reserves: Building and maintaining strategic rice reserves can help buffer against short-term disruptions in world rice shortage, ensuring a steady supply.
- Technological Investments: Investing in technology to enhance rice world production efficiency and resilience, from precision farming to supply chain management tools, can mitigate the effects of global rice shortage.
- International Cooperation: Strengthening international cooperation and dialogue can lead to more coordinated responses to crises affecting rice export news, including diplomatic efforts to ensure the security of critical maritime routes.
The Trade Vision, as a reputed EXIM data provider, offers invaluable insights and analytics that can help businesses navigate the complexities of global trade, especially in times of uncertainty like the attacks in the Red Sea.

How Can the International Community Support Affected Countries?
- Financial Aid and Technical Support: Financial aid and technical assistance to enhance rice world production capabilities in affected regions can help mitigate the impact of global rice shortage.
- Trade Agreements: Facilitating new trade agreements or relaxing existing ones can help ensure a steady flow of rice and other essential goods, countering the effects of the world rice shortage.
- Research and Development: Supporting research into more resilient rice strains and more efficient farming practices can increase productivity and sustainability, benefiting basmati export from India and global rice production.
What Lessons Can Be Learned from This Crisis?
- Importance of Supply Chain Diversification: This crisis highlights the critical need for countries to diversify their supply chains to reduce vulnerability to global rice shortage.
- Resilience Building: Developing more resilient infrastructure and logistics capabilities is essential to withstand disruptions like the attacks in Red Sea.
- Cooperation Over Competition: The rice export news underscores the importance of international collaboration over competition, encouraging collective efforts to address food security challenges.
Looking Ahead with The Trade Vision
As the situation evolves, platforms like The Trade Vision offer valuable insights and forecasts for the rice world production and basmati export from India. By analyzing market trends and geopolitical developments, The Trade Vision guides businesses through the complexities of international trade in these turbulent times.
The attacks in the Red Sea present a significant challenge to India's rice export and the broader issue of global rice shortage. By understanding these impacts and exploring solutions, stakeholders can work towards minimizing disruption and ensuring food security for populations worldwide.
FAQs:
Q1. What can consumers do to mitigate the impact of a rice shortage?
Ans: Consumers can contribute by diversifying their diets and reducing waste, thereby lessening the demand pressure on rice supplies.
Q2. How long will the impact of the Red Sea attacks last?
Ans: The impact duration is still being determined and will depend on the resolution of security issues and the ability of trade routes to adapt to new challenges.
Q3. What impact do logistics and transportation have on rice availability?
Ans: Logistics and transportation are crucial for running rice world production and distribution. Disruptions in shipping routes, like the attacks in the Red Sea, can significantly impact basmati export from India and the overall global supply chain, leading to delays and increased costs.

What Is IEC Code: A Detailed Guide to It
27 Mar, 2024
0
Understanding the essentials can pave the way for a flourishing business in global trade. One important thing that stands out is the Import Export Code (IEC). Often, newcomers and even seasoned traders find themselves pondering questions like what the IEC code is, what an import export license is, and what the benefits of an import export license are. This comprehensive guide aims to unravel the mysteries surrounding the IEC code. It offers a clear insight into its importance, the application process, and how it benefits traders.
What Is Import Export Code?
Import Export Code (IEC) is a unique 10-digit code necessary for businesses importing and exporting goods. This code is issued by the Directorate General of Foreign Trade (DGFT), Ministry of Commerce and Industries, Government of India. The essence of what is IEC code lies in its role as a key to entering the global market, making it an indispensable part of international trade.

Why Is It Mandatory?
The IEC code is not just another bureaucratic formality; it serves as a vital document for recognizing a business as a legitimate participant in international trade. With this code, businesses can legally import or export goods. It also facilitates the smooth clearance of shipments at customs. It enables companies to avail themselves of benefits under the Export Promotion Capital Goods (EPCG) and the Duty Drawback Scheme.
The Application Process
Securing an IEC code is a streamlined process that encourages businesses to expand their horizons globally. Here's a brief overview:
- Preparation: Before applying, ensure all required documents, such as PAN cards, business registration certificates, and bank details, are in order.
- Application: The application for the Import Export Code is submitted online through the DGFT's official website. The necessary documents and the prescribed fee must accompany it.
- Processing: Once submitted, the application is processed by the DGFT. If all details are correct and documents are in order, the IEC code is usually issued within a few days.
This procedure demystifies what is import export license and showcases how accessible the government has made international trading.

Benefits of Import Export License
- The Gateway to Global Trade
The most direct benefit of the import export license is its role as a gateway for businesses to enter international markets. It legitimizes a business's trade activities and opens up opportunities for growth and expansion.
- Financial Incentives
Holding an IEC code allows businesses to benefit from various government schemes. These incentives, ranging from tax rebates to subsidies, are designed to support businesses in the competitive international market.
- Easy Clearances
For those wondering what import-export codes are used for beyond mere compliance, they play a critical role in facilitating easier customs clearance for both imports and exports. This efficiency is crucial for businesses to maintain timely deliveries and operations.
How Can Businesses Ensure Compliance and Manage Documentation Efficiently?
Understanding, what is import export license involves recognizing the importance of compliance and efficient documentation management. Here are vital pointers to navigate this aspect:
- Stay Informed: Regularly update your knowledge of international trade laws and regulations. It ensures your business operations align with global standards.
- Organize Documentation: Keep all trade-related documents, such as invoices and packing lists, organized and readily accessible. It helps in smooth customs clearance.
- Leverage IEC Code: Use your Import Export Code effectively to simplify and expedite the documentation process, taking full advantage of the benefits of import export license.
- Seek Expertise: Consider consulting with trade experts or platforms like The Trade Vision for insights into complex compliance requirements.
How Can Leveraging Technology Benefit International Trade Operations?
Incorporating technology into your international trade operations can significantly enhance efficiency and competitiveness. Here are ways technology intersects with what is IEC code:
- Embrace EDI Systems: Implement electronic data interchange (EDI) systems for faster, more accurate document handling.
- Adopt Blockchain: Explore blockchain for secure, transparent transactions, enhancing trust in international dealings.
- Utilize Analytical Tools: Use data analytics to understand market trends, manage risks, and make informed decisions, maximizing the benefits of import export license.
- Digitalize for Efficiency: Digitize trade processes where possible to reduce paperwork, save time, and decrease the risk of errors, fully embracing what is import export code in the digital age.

Looking to the Future with The Trade Vision
Platforms like The Trade Vision play a pivotal role as we steer towards a future marked by the digitalization of trade and streamlined global operations. They offer a wealth of knowledge and tools for businesses to not only understand what is IEC code is but also to overcome the complexities of international trade efficiently. With insights into market trends, regulatory changes, and strategic advice, The Trade Vision supports businesses leveraging their import export license for maximum benefit.
The Import Export Code is a cornerstone for businesses aiming to make their mark internationally. Understanding what is import export code, its application process, and the benefits of import export license equips traders with the knowledge to unlock global opportunities. As the world becomes more interconnected, the significance of the IEC code in fostering international trade relations and supporting business growth cannot be overstated. With resources like The Trade Vision, businesses are better positioned than ever to navigate the complexities of global trade and harness the full potential of their international endeavours.
FAQs:
Q1. Can a business operate without an IEC Code?
Ans: Engaging in import or export activities without a valid IEC code is illegal and can result in severe penalties. The IEC code is foundational for establishing a legitimate international trading business.
Q2. Is renewal required for IEC Code?
Ans: One of the attractive features of the IEC code is that it is issued for a lifetime. Once obtained, renewal is unnecessary, simplifying long-term business planning and operations.
Q3. What happens if I lose my IEC Code?
Ans: If you lose your IEC code, obtaining a duplicate is straightforward. The DGFT can be contacted with the necessary documents and a nominal fee to issue a duplicate code.
Q4. Can any business apply for an IEC Code?
Ans: Any business aiming to trade internationally can apply for an Import Export Code. The requirement is a valid business registration and a PAN card, making the process accessible.
Q5. How does the IEC Code facilitate global trade?
Ans: The Import Export Code legalizes international trade for businesses, streamlines customs clearance, enables access to government benefits, and enhances credibility with global partners and financial institutions.

The Best Practices of Import and Export Operations in Supply Chain Management
26 Mar, 2024
0
Introduction:
Efficient import and export operations are integral components of supply chain management. Whether it's sourcing raw materials, manufacturing goods, or distributing products, optimizing import and export processes is crucial for businesses to remain competitive in the international market. This article explores the best practices and strategies for streamlining import and export operations within supply chain management.
Understanding Import and Export in Supply Chain Management
Import and export operations involve the movement of goods and services across international borders. In supply chain management, these processes encompass various stages, from procurement and production to distribution and delivery. Effective management of import and export activities ensures seamless flow and timely delivery of products while minimizing costs and risks.

Key Components of Import and Export Supply Chain
Compliance and Regulatory Considerations:
- Understanding Trade Regulations: Stay abreast of import and export regulations, tariffs, and trade agreements relevant to specific markets.
- Documentation Management: Ensure accurate and timely completion of customs documentation, including invoices, certificates of origin, and permits.
- Compliance Audits: Conduct regular audits to ensure adherence to regulatory requirements and mitigate the risk of penalties or delays.
Supplier and Partner Collaboration:
- Vendor Selection: Choose reliable suppliers and partners with a proven track record of compliance, quality, and reliability.
- Transparent Communication: Establish open communication channels with suppliers and partners to anticipate and address potential issues proactively.
- Collaboration Tools: Utilize digital platforms and tools for real-time tracking, inventory management, and collaboration with stakeholders across the supply chain.

Logistics and Transportation Optimization:
- Mode Selection: Evaluate the most cost-effective and efficient transportation modes, such as air, sea, road, or rail, based on factors like distance, urgency, and cargo volume.
- Route Optimization: Optimize shipping routes to minimize transit time, reduce fuel consumption, and mitigate risks associated with disruptions or congestion.
- Freight Forwarding Services: Partner with experienced freight forwarders to handle logistics complexities, customs clearance, and documentation requirements efficiently.
Risk Management and Contingency Planning:
- Supply Chain Visibility: Implement technology-driven solutions for real-time tracking and monitoring of shipments, enabling early detection of potential disruptions.
- Risk Assessment: Identify and assess potential risks, including geopolitical instability, natural disasters, or supplier disruptions, and develop contingency plans to mitigate their impact.
- Insurance Coverage: Obtain appropriate insurance coverage to protect against unforeseen events and mitigate financial losses associated with damaged or lost shipments.
Best Practices for Import Supply Chain Process:
- Streamlined Customs Clearance: Implement automated customs clearance processes and leverage customs brokers to expedite clearance and reduce delays.
- Tariff Classification: Ensure accurate tariff classification of imported goods to minimize duty costs and compliance risks.
- Duty Optimization: Explore duty reduction programs, such as free trade agreements or preferential tariff schemes, to minimize import duties and taxes.
- Inventory Management: Adopt advanced inventory management systems to optimize stock levels, reduce carrying costs, and improve order fulfillment efficiency.
Best Practices for Export Supply Chain Process:
- Market Research and Localization: Conduct market research to identify export opportunities and tailor products or services to meet the needs and preferences of target markets.
- Export Compliance Training: Provide training to staff involved in export operations to ensure awareness of export controls, sanctions, and regulatory requirements.
- Export Documentation Automation: Utilize digital platforms and software solutions for automating export documentation processes, reducing errors, and enhancing compliance.
- Trade Financing: Explore export financing options, such as letters of credit or export credit insurance, to mitigate financial risks and facilitate international transactions.
Read more: How to Get Import Export Data for Any Country
|
|||||||||||||||||||||||
FAQs:
Q1. What are the key considerations when selecting suppliers for import operations?
Ans: When selecting suppliers for import operations, it's crucial to consider factors such as reliability, quality, compliance, and cost-effectiveness. Look for suppliers with a proven track record of timely delivery, adherence to regulatory requirements, consistent product quality, and competitive pricing. Conduct thorough due diligence, including supplier audits and reference checks, to ensure compatibility with your supply chain goals and requirements.
Q2. How can businesses mitigate the risks associated with import/export compliance?
Ans: Businesses can mitigate compliance risks by staying informed about import/export regulations, maintaining accurate documentation, conducting regular compliance audits, and investing in employee training. Additionally, leveraging technology solutions for automated compliance checks and implementing robust risk management processes, such as risk assessments and contingency planning, can help identify and address compliance issues proactively.
Q3. What role does technology play in optimizing import/export operations?
Ans: Technology plays a crucial role in optimizing import/export operations by providing real-time visibility and control over shipments, streamlining documentation processes, enhancing communication and collaboration with stakeholders, and facilitating data-driven decision-making. Advanced technologies such as blockchain, artificial intelligence, and Internet of Things (IoT) enable greater transparency, efficiency, and traceability across the supply chain, leading to improved operational performance and customer satisfaction.
Q4. How can businesses ensure effective communication and collaboration across the import/export supply chain?
Ans: Effective communication and collaboration across the import/export supply chain can be ensured by establishing clear communication channels, fostering open dialogue among stakeholders, leveraging digital collaboration tools and platforms, and implementing standardized processes and procedures. Regular communication, feedback mechanisms, and performance reviews can help align goals, resolve issues, and build trust among supply chain partners.
Q5. What are some common challenges faced by businesses in import/export operations, and how can they be addressed?
Ans: Common challenges in import/export operations include regulatory compliance, customs clearance delays, transportation inefficiencies, currency fluctuations, geopolitical risks, and supplier/vendor management. To address these challenges, businesses can adopt proactive risk management strategies, invest in technology solutions for automation and visibility, diversify sourcing and distribution channels, establish robust supplier relationships, and stay agile and adaptable to changing market conditions. Additionally, seeking guidance from industry experts and trade associations can provide valuable insights and support in navigating complex import/export landscapes.
Conclusion:
Efficient import and export operations are vital for the success of supply chain management in today's global marketplace. By implementing best practices, leveraging technology, and fostering collaboration across the supply chain, businesses can optimize import and export processes, enhance operational efficiency, and gain a competitive edge in the international arena. Embracing innovation and continuous improvement is key to navigating the complexities of global trade and achieving sustainable growth in an increasingly interconnected world

Essential Documents Required for Import and Export: A Comprehensive Guide
22 Mar, 2024
0
In international trade, ensuring smooth import and export operations is contingent upon meticulous documentation. Whether you're importing goods to meet demand or exporting products to explore new markets, having the right paperwork in order is crucial. This article serves as a comprehensive guide, outlining the essential documents required for import and export transactions.
Understanding Import and Export Documentation
Before delving into the specific documents needed for import and export, it's essential to grasp the significance of documentation in facilitating global trade. Import and export documentation serves multiple purposes, including regulatory compliance, customs clearance, payment facilitation, and dispute resolution. Proper documentation not only expedites the movement of goods across borders but also mitigates risks and ensures transparency in transactions.

List of Documents Required for Import
1. Import License or Permit: Depending on the nature of the goods and regulatory requirements of the importing country, an import license or permit may be necessary. This document authorizes the importer to bring specified goods into the country.
2. Commercial Invoice: The commercial invoice serves as a bill of sale between the buyer and seller, detailing the description, quantity, value, and terms of the goods being imported. It is essential for customs clearance and valuation purposes.
3. Packing List: This document provides a detailed list of the contents, packaging specifications, and weight of each package within the shipment. It assists customs officials in verifying the contents of the shipment and ensures accurate handling and delivery.
4. Bill of Lading (B/L): Issued by the carrier or freight forwarder, the bill of lading serves as a contract of carriage and a receipt for the goods being transported. It contains essential information such as the shipper, consignee, vessel details, and terms of shipment.
5. Certificate of Origin: This document certifies the country of origin of the goods and may be required for customs clearance, trade agreements, or preferential tariff treatment. It is typically issued by the exporter or a designated authority.
6. Import Declaration Form: Also known as a customs declaration or entry form, this document provides detailed information about the imported goods, including their classification, value, and origin. It is submitted to customs authorities for assessment of duties and taxes.
7. Import Permit for Restricted Goods: Certain goods may require additional permits or approvals for importation due to regulatory restrictions or safety concerns. Examples include firearms, pharmaceuticals, and hazardous materials.
List of Documents Required for Export
1. Export License or Permit: Similar to import permits, export licenses or permits may be required for certain goods subject to export controls or regulatory restrictions. This document authorizes the exporter to ship specified goods out of the country.
2. Export Declaration Form: This document provides detailed information about the exported goods, including their description, quantity, value, destination, and intended use. It is submitted to customs authorities for regulatory compliance and statistical purposes.
3. Commercial Invoice: Just like in import transactions, a commercial invoice is essential for export transactions. It serves as a legal document evidencing the sale of goods between the exporter and importer, facilitating payment and customs clearance.
4. Packing List: Similar to import shipments, a packing list detailing the contents, packaging, and weight of each package is necessary for export shipments. It aids in cargo handling, inspection, and verification by customs officials.
5. Bill of Lading (B/L) or Air Waybill (AWB): Depending on the mode of transportation, either a bill of lading for sea shipments or an air waybill for air shipments is required. These documents serve as contracts of carriage and provide proof of shipment and delivery.
6. Certificate of Origin: In export transactions, a certificate of origin attests to the country of origin of the goods. It may be required by customs authorities in the importing country for tariff classification and eligibility for preferential trade agreements.
7. Export Packing Declaration: This document certifies that the goods have been properly packed, labeled, and marked in accordance with regulatory requirements and international standards. It ensures compliance with safety, security, and transport regulations.
8. Export License for Controlled Goods: For goods subject to export controls, such as military equipment, dual-use items, or sensitive technologies, an export license may be necessary. This document ensures compliance with export regulations and prevents the proliferation of restricted goods.
Read more: What Is International Trade: Everything You Need to Know About Its Types and Importance

Navigating the complexities of import and export operations requires meticulous attention to documentation requirements. From import permits to export declarations, each document plays a vital role in facilitating trade, ensuring regulatory compliance, and mitigating risks.
FAQs:
Q1. What is an Import/Export License or Permit, and why is it required?
Ans: An import/export license or permit is a regulatory document issued by the relevant authorities authorizing the movement of specified goods across international borders. It is required to ensure compliance with import/export regulations, monitor trade activities, and prevent the illicit movement of restricted or controlled goods.
Q2. What are the consequences of non-compliance with import/export documentation requirements?
Ans: Non-compliance with import/export documentation requirements can result in various consequences, including customs delays, fines, penalties, seizure of goods, and legal action. Additionally, it can damage business reputation, disrupt supply chains, and hinder market access.
Q3. How can businesses obtain import/export permits or licenses?
Ans: The process for obtaining import/export permits or licenses varies depending on the country, type of goods, and regulatory requirements. Generally, businesses need to submit applications to the relevant government agencies or customs authorities, providing details about the goods, intended use, destination, and compliance measures.
Q4. What are the differences between a Bill of Lading and an Air Waybill in export transactions?
Ans: A Bill of Lading (B/L) is a document issued for sea shipments, serving as a contract of carriage and a receipt for the goods being transported. An Air Waybill (AWB) is used for air shipments and serves similar purposes. While both documents evidence the shipment of goods, they differ in terms of the mode of transportation and specific information included.
Q5. Are there any resources or platforms available to assist businesses with import/export documentation requirements?
Ans: Yes, several resources and platforms are available to assist businesses with import/export documentation requirements, including government websites, trade associations, customs brokers, and digital trade platforms. These resources provide guidance, templates, and tools to facilitate the preparation and submission of import/export documents, ensuring compliance and efficiency in international trade transactions.
Conclusion:
Accurate and complete documentation is the cornerstone of successful import and export operations. By understanding the specific documents required for import and export transactions and adhering to regulatory requirements, businesses can minimize risks, expedite customs clearance, and foster smooth and efficient trade relationships on a global scale. Whether importing raw materials or exporting finished products, having the right paperwork in order is essential for navigating the complexities of international trade and capitalizing on market opportunities.

Mexico Has Surpassed China as the Primary Source of Goods Imported by the US
21 Mar, 2024
0
In a crucial shift in global trade dynamics, Mexico has overtaken China to become the primary source of goods imported by the United States. This transition underscores international commerce's evolving nature and the deepening of Mexico-US trade relations. According to data from the US Commerce Department, the value of goods imported from Mexico to the US saw a nearly 5% increase from 2022 to 2023, reaching over $475 billion. Concurrently, the value of goods imported from China saw a 20% decrease, totalling $427 billion. This article looks into the factors behind this shift, its implications, and what might signal for future trade between the United States and Mexico.
The Rise of Mexico as a Trade Partner
Mexico's ascent as the top source of import goods for the US is gradual but the result of several factors. Proximity is critical, offering logistical advantages like lower shipping costs and faster delivery times compared to distant Asian markets. Furthermore, Mexico's participation in the USMCA (United States-Mexico-Canada Agreement) has fostered a more favourable trade environment, encouraging businesses to import goods from Mexico to the US.
Declining Imports from China
Simultaneously, the reduction in Chinese imports can be attributed to a mix of tariffs, geopolitical tensions, and companies diversifying their supply chains in response to recent global disruptions. These factors have compelled businesses to reconsider their sourcing strategies, increasingly turning to Mexico as a reliable alternative.

Understanding the Impact
- On the Economy
This shift in trade between the United States and Mexico bolsters economic ties, potentially leading to more job creation and investment in both countries. For the US, accessing a diverse range of products more efficiently supports consumer demand and business needs.
- On Supply Chains
The proximity of Mexico considerably enhances supply chain resilience for American companies. Quicker turnaround times and reduced transportation costs benefit businesses and contribute to lower carbon footprints, aligning with growing sustainability goals. What Does This Mean for Businesses?
- Re-evaluating Supply Chains
For businesses, the shift necessitates a reevaluation of supply chain strategies. Companies previously reliant on Chinese imports are now exploring the advantages of importing from Mexico to the US. This transition requires adjustments in logistics, supplier relationships, and compliance with trade regulations under the USMCA.
- Embracing Flexibility and Diversification
Embracing flexibility and diversification in sourcing and manufacturing becomes crucial. Companies find value in not putting "all their eggs in one basket," spreading risk across multiple countries to mitigate future disruptions.
Challenges and Opportunities
Both nations face unique challenges and opportunities as US and Mexico trade continues to flourish. The rapid growth in trade volume necessitates significant enhancements in cross-border infrastructure and customs processes to streamline the flow of import goods from Mexico to the US. Addressing these logistical challenges is crucial for maintaining the momentum of trade growth and ensuring that businesses can benefit from this partnership efficiently.
Moreover, the increased trade volume presents opportunities for technological advancement and logistics and supply chain management innovation. Investments in digital infrastructure, such as blockchain for secure and transparent transactions, can further enhance Mexico-US trade relations. These innovations not only support the current trade volume but also prepare both countries for future increases in trade activities. Embracing technology will be vital in overcoming logistical hurdles and setting a global standard for efficient and secure trade.
Strengthening Economic Resilience
The shift towards importing from Mexico to the US significantly contributes to the economic resilience of both nations. By diversifying supply chains and reducing reliance on distant suppliers, companies can mitigate risks associated with geopolitical tensions, natural disasters, and other disruptions. This strategic diversification strengthens the region's economic stability, making the North American economy more resilient to global shocks.
Additionally, the closer economic integration between the US and Mexico fosters an environment conducive to joint ventures and collaborations that can spur innovation and development across industries. This collaborative approach enhances both nations' competitive edge on the global stage and supports sustainable economic growth and job creation. As trade between the United States and Mexico deepens, leveraging this partnership for financial resilience and innovation becomes increasingly important.
Read more: China Import Export Data and Analysis
How Can Businesses Maximize Benefits from US-Mexico Trade Relations?
To fully leverage the advantages of importing from Mexico to the US, businesses should consider several strategic actions:
- Understand Regulatory Changes: Stay informed about the latest trade agreements and regulatory changes within the USMCA framework. This is crucial for understanding the complexities of US and Mexico trade efficiently and legally.
- Invest in Relationships: Building strong, long-term relationships with Mexican suppliers can lead to more favourable terms, better quality control, and more reliable supply chains. Trust and mutual understanding are vital to successful trade between the United States and Mexico.
- Leverage Proximity for Agile Supply Chains: Use Mexico's geographical proximity to your advantage by creating more agile and responsive supply chains. It can help businesses react quickly to market changes, reducing lead times and inventory costs.
- Focus on Sustainability: With increasing consumer and regulatory pressures, integrating sustainability into your supply chain is beneficial for the environment and your brand's reputation. Sustainable practices in Mexico-US trade relations can also lead to cost savings and innovation.
- Embrace Technological Innovation: Adopting new technologies can streamline operations, enhance transparency, and improve efficiency. Technology is a powerful tool in optimizing import goods from Mexico to the US, from blockchain for secure tracking to AI for demand forecasting.
Partnering with an expert like The Trade Vision, renowned for its mastery of EXIM data, can provide invaluable insights and strategies for overcoming the complexities of US and Mexican trade. Their expertise enables businesses to identify emerging trends, optimize trade processes, and unlock new import opportunities in US and Mexico trade.

Looking Ahead
Mexico-US trade relations appear poised for continued growth and collaboration. The Trade Vision suggests that businesses and policymakers recognize the importance of building resilient, efficient, and sustainable trade networks. Emphasizing the development of digital trade, improving border infrastructure, and fostering innovation, the path forward is marked by a commitment to leveraging trade for mutual benefit and environmental stewardship.
The ascendancy of Mexico as the primary source of import goods for the US marks a pivotal moment in global trade. This shift reflects the changing economic and geopolitical scene and offers a blueprint for future trade between the United States and Mexico. As businesses and governments navigate this new terrain, the focus will be on harnessing the full potential of this partnership to drive economic growth, innovation, and sustainability in the years to come.
FAQs
Q1. How will this affect consumer prices?
Ans: The impact on consumer prices is complex and varies by sector. While some products may see price reductions due to lower shipping costs, others might experience increases if manufacturing costs in Mexico are higher than in China.
Q2. What should companies consider when importing from Mexico to the US?
Ans: Companies should consider factors such as compliance with USMCA regulations, the potential for tariff changes, and the importance of developing solid relationships with Mexican suppliers. Understanding local laws and cultural nuances is also crucial.
Q3. Are there environmental benefits to this shift?
Ans: Yes, shorter shipping distances can reduce carbon emissions, making US and Mexico trade more environmentally sustainable than trans-Pacific shipments. Additionally, both countries could leverage this shift to invest in greener technologies and infrastructure.
Q4. What are the critical products imported from Mexico to the US?
Ans: The range of import goods from Mexico to the US is diverse, encompassing automotive parts, electronics, agricultural products, and more. Understanding the key products can help businesses identify potential opportunities for diversification and expansion within US-Mexico trade relations.
Q5. How do tariffs affect US-Mexico trade?
Ans: Tariffs play a significant role in trade between the United States and Mexico. Changes in tariff policies can directly impact the cost and flow of import goods from Mexico to the US. Businesses must stay informed about current tariff regulations to navigate importing from Mexico to the US effectively and maintain profitability.

India Is Considering Extending Parboiled Rice Tax at Risk to World Supply
20 Mar, 2024
0
In a significant development that could ripple through global food markets, India, a dominant player in the international rice trade, is contemplating extending an export tax on parboiled rice. This move has sparked concerns over its potential impact on world supply, especially considering the vital role of rice export from India in meeting global demand. As nations worldwide grapple with food security and price stability challenges, India's decision carries weight far beyond its borders. This article looks into the complexities of this situation, offering insights into the current state of parboiled rice exports from India, the implications of the proposed export tax, and the broader context of rice export latest news.
India's Role in Global Rice Markets
India is the world's largest rice exporter, contributing significantly to the global supply of this staple grain. The country's fertile lands and favourable climate conditions have historically positioned it as a key supplier of various rice varieties, including nutrient-rich parboiled rice. However, the government's consideration of extending the export tax on rice in India has raised alarms about potential disruptions in the international food supply chain.
The Significance of Parboiled Rice Exports from India
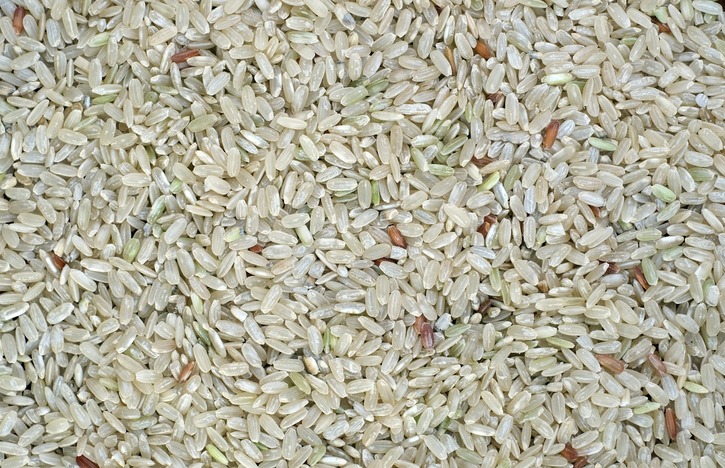
Parboiled rice, known for its enhanced nutritional profile and cooking qualities, represents a substantial portion of India's rice exports. It serves as a crucial food source for millions worldwide and a vital component of food security in several developing nations. The prospect of an extended export tax on this commodity threatens not just the livelihoods of Indian farmers and exporters but also the stability of global rice prices and supplies.

How Will an Export Tax Affect Farmers and Exporters in India?
- Impact on Farmers: Farmers specializing in parboiled rice could face reduced income due to lower demand from international markets. With rice export from India constituting a significant part of their livelihood, the extended tax could lead to economic uncertainties for these agricultural producers.
- Effect on Exporters: Exporters dealing in parboiled rice exports from India may encounter challenges in maintaining their market share on the global stage. The tax could necessitate a shift in business strategies, focusing more on domestic markets or exploring alternative crops not subject to export restrictions.
Read more: The white staple is high in demand
What Are the Global Alternatives if Indian Rice Exports Decline?
- Seeking Other Suppliers: Countries dependent on rice export from India might turn to other major rice-producing nations like Thailand, Vietnam, and Pakistan. These countries could increase their exports to fill the gap left by India. Still, it remains to be seen if they can match the price and quality that buyers have come to expect from Indian rice.
- Diversifying Food Sources: A decline in parboiled rice exports from India may also prompt importing countries to diversify their food sources. It could involve investing in local agricultural development or seeking alternative grains like wheat, maize, or quinoa, which could help reduce dependence on rice imports and enhance food security.
How Does the Export Tax Reflect on India's Trade Policy and Global Standing?
The contemplation of extending the export tax on rice in India marks a significant moment in the country's approach to trade policy and its role in the global agricultural market. This move reflects a broader strategy to balance domestic food security with international trade obligations, a dilemma faced by many countries that are key food producers. As a leading supplier in the rice export latest news, any significant shift in its export policies can alter global rice availability and prices, impacting countries dependent on these imports for their food needs.
Looking Ahead
The discourse around extending the export tax on rice in India reflects broader themes of sustainability, equity, and resilience in global trade practices. The importance of a cohesive trade vision becomes apparent as nations navigate the complexities of ensuring food security while promoting sustainable agricultural practices. As advocated by The Trade Vision, the expert in EXIM data, such a vision emphasizes the need for policies that support both local and global needs, supporting activities that are favorable to the earth, ethical for everyone, and beneficial for business.
India's contemplation of extending the export tax on parboiled rice presents a critical moment for global food security and trade dynamics. As the world watches closely, India's decisions will affect its domestic market and have far-reaching implications for global rice supply and prices. Global stakeholders must engage in dialogue, fostering a trade environment that balances the needs of all parties while ensuring the long-term sustainability of our planet's food systems.
FAQs
Q1. What is parboiled rice?
Ans: Parboiled rice is partially precooked rice, making it more nutritious and easier to store than white rice.
Q2.Why is India considering an export tax on rice?
Ans: The primary reasons include ensuring domestic food security, managing water resources, and stabilizing local market prices amid fluctuating global demand.
Q3. How could the export tax affect global rice prices?
Ans: By reducing the quantity of rice available for export from India, the tax could lead to higher global rice prices due to supply constraints.
Q4. Can other countries compensate for the shortfall in rice exports from India?
Ans: While other rice-exporting countries might increase their exports, it's still being determined whether they can fully offset the reduction from India, especially in the short term.

An Overview of Import and Export Trade Data Analysis Using a Trade Database
13 Feb, 2024
0
In the ever-changing global commerce, mastering the art of trade data analysis is crucial for businesses aiming to stay competitive. It's not just about accessing data but understanding and utilising this information effectively. This comprehensive guide takes you through the uses of import trade data and import export data analysis , focusing on how advanced trade data analysis tools like The Trade Vision can transform data into actionable business intelligence.
What is Trade Data Analysis?
Trade data analysis involves scrutinising the flow of goods across international borders. It's a systematic approach that enables businesses to decode complex market trends, evaluate competition, and craft well-informed strategies. In the context of international trade imports and exports data, this analysis offers a broad perspective of global trade activities, empowering businesses to plan their market entry and expansion thoughtfully.

Why We Need Import and Export Trade Database Analysis
Trade data analysis is not just about examining figures; it's about extracting meaningful insights that drive strategic decisions. Here's how database analysis becomes a game-changer for businesses:
1. Market Insights:
- Demand Forecasting: Effective import trade data analysis helps businesses anticipate future product demand, considering historical trends and current market conditions.
- Supply Chain Optimization: Grasping the intricacies of trade flows allows companies to fine-tune their supply chain, balancing efficiency with cost-effectiveness.
- Emerging Trends Identification: A proactive approach to trade data analysis helps businesses spot and leverage emerging market trends, staying ahead of the curve.
2. Competitive Analysis:
- Strategy Benchmarking: By engaging in import export data analysis, businesses can compare their strategies against market leaders, uncovering areas ripe for improvement and recognising strategic strengths.
- Market Share Evaluation: Understanding your market share relative to competitors can shed light on the impact of your marketing and sales strategies.
- Product Performance Analysis:Trade data analysis allows businesses to assess how their products fare against competitor's, paving the way for innovation and improvement.
3. Risk Management:
- Market Volatility Assessment: Trade data can unveil market volatility patterns, enabling businesses to brace for and mitigate the impact of market shifts.
- Regulatory Compliance: Trade data analysis provides insights into the regulatory landscape of different markets, guiding businesses to ensure compliance and avoid hefty fines.
- Supply Chain Vulnerability: A thorough analysis of trade data can highlight vulnerabilities in the supply chain, prompting businesses to devise effective contingency strategies.

Using The Trade Vision Database for Import and Export Analysis
The Trade Vision (TTV) emerges as a powerful export import data intelligence portal, transforming raw data into valuable insights and fostering a smart approach to success. Here's how TTV's innovative approach to data empowers businesses:
- Comprehensive Data Collection: TTV aggregates international trade imports and exports data from over 200 countries, offering a holistic view of global trade activities.
- Customised Analysis: TTV allows businesses to tailor their trade data analysis to focus on specific market segments, products, or geographic regions.
- Real-Time Insights: Access to real-time data through TTV enables businesses to make timely decisions and maintain a competitive edge.
TTV's Client Base and Brand Identity
With over 20,000 clients worldwide, TTV's reputation as a leader in import trade dataand import export data analysis is undisputed. The platform's mission is to demystify data, making it accessible and actionable for businesses across the globe.
TTV's Comprehensive Services
- Export Import Data of 200+ Countries: TTV provides a comprehensive view of global trade dynamics. Deep insights into market trends and trade patterns are at your fingertips with TTV.
- Customised Dashboard Reports: TTV's dynamic dashboards allow businesses to visualise key indicators and strategic information, enhancing decision-making and market penetration.
- Data-Informed Decision Making: Empower your business with TTV's data-driven insights for strategic planning and execution.
TTV's Key Features
- Customised Import Export Data Report: TTV offers tailored reports to meet specific business needs.
- Personal & Shared Workspace: Collaborate efficiently with TTV's shared workspaces.
- User-friendly Interface with Tutorial Video: TTV ensures everyone can easily navigate its platform and generate insightful reports.
Understanding Market Dynamics with Precision
Navigating market dynamics with precision is an advantage and a necessity for businesses aiming to excel. The Trade Vision (TTV) offers tools designed to decode complex trade data analysis and present it in an understandable and actionable format. This capability enables businesses to manoeuvre through the volatile international trade imports and exports data with informed confidence.

Conclusion
The Trade Vision (TTV) redefines how businesses approach trade data analysis. By offering an unparalleled depth of international trade imports and exports data, TTV equips businesses with the data they need and the insights and foresight necessary to thrive in the competitive global arena. Whether it's understanding import trade data to optimise supply chains, conducting import export data analysis for strategic market positioning, or tapping into new market opportunities with precision, TTV provides the tools and intelligence that businesses need to navigate the complexities of global trade confidently.
With its user-centric platform, customised solutions, and commitment to empowering businesses, TTV stands as an ally for any company aiming to leverage the power of data for growth, innovation, and success in the international marketplace. With TTV, global trade isn't just a market to enter; it's a world of opportunities waiting to be explored and conquered.
FAQs
Q1. How does TTV ensure the accuracy of its data?
Ans: TTV prides itself on sourcing data from reputable, official channels and employs rigorous validation processes to ensure the highest accuracy and reliability.
Q2.Can TTV identify new export markets?
Ans: TTV's extensive database and sophisticated analysis tools can help businesses pinpoint and strategically target new export markets.
Q3. Is the TTV platform user-friendly for non-technical users?
Ans: TTV's intuitive interface, personalised dashboards, and comprehensive tutorial videos make trade data analysis accessible and straightforward for users of all backgrounds.
Q4. How does TTV aid in competitive benchmarking?
Ans: With its extensive data on market share, growth patterns, and competitors' strategic moves, TTV is an invaluable tool for businesses conducting thorough competitive benchmarking.

How to Get Import Export Data for Any Country
13 Feb, 2024
0
Global trade is essential to economic growth, with businesses relying on accurate and timely import export data to make informed decisions. Accessing and analysing export import data by country is crucial for companies aiming to compete effectively in international markets. This comprehensive guide will provide valuable insights into how to find import export trade data, utilise a reliable export import data bank, and understand how to find import data of a company or export data.
What is Import and Export?
Import refers to bringing goods or services into a country from abroad for sale. Export, conversely, involves sending goods or services from one country to another for sale. These transactions are fundamental components of international trade, and their data provides insights into a country's economic health, market trends, and trade relationships.
What is Import Export Data?
Import export data refers to the records of trade transactions between countries. This data includes details about the products being traded, their value, the countries involved, and much more. Businesses and analysts use this data to track market trends, evaluate the performance of products or industries, and make strategic decisions.
Why is Import Export Data Important?
Access to accurate and comprehensive import export trade data is crucial for businesses looking to expand their market reach or maintain a competitive edge in their industry. This data helps understand market demands, identify potential partners or competitors, and evaluate economic trends.
How to Find Import Data of a Company
1. Customs and Border Protection Records
- Many countries maintain records of goods entering their borders. In the US, for example, the Customs and Border Protection (CBP) keeps detailed records of imports.
2. Shipping Manifests and Bill of Lading
- These documents contain details about the imported goods, their value, origin, destination, and the parties involved.
- Trade Databases and Import Export Data Providers
- Utilise platforms that specialise in gathering and analysing trade data. They can offer detailed insights into a company's import activities, including volume, frequency, and the nature of goods imported.
3. Industry Associations and Trade Groups
- Sometimes, industry-specific associations maintain databases of import statistics and can provide insights into the import activities of companies within that sector.
4. Government Trade Data
- Governments often release trade data that can be accessed publicly. This data can sometimes be used to track the import activities of specific companies, especially in countries with transparent trade practices.
How to Find Export Data of a Company
1. Shipping and Freight Records
- The export version of shipping manifests and Bills of Lading can provide details about the nature, volume, and destination of exported goods.
2. Trade Data Services
- Specialised trade data platforms provide searchable databases where you can find detailed export activities of companies.
3. Government and International Trade Portals
- Many countries have dedicated portals for trade data that include detailed export statistics.
4. Industry Reports and Market Analysis
- Market research firms and industry analysts often publish reports that include export data for major industry players.
5. Direct Company Reports
- Publicly traded companies often include import and export data in their annual reports or financial disclosures, especially if such activities are a significant part of their business.
Why a Reliable Import Export Data Bank is Crucial?
Finding and understanding a company's import and export data can be challenging. The complexity arises from going through vast amounts of data and analysing the economic implications of the trade activities. Finding a reliable import export data bank on a trusted site becomes paramount.
1. Accuracy and Reliability
- A trusted import export data bank ensures the data you access is accurate and reliable, minimising the risk of making decisions based on faulty information.
2. Ease of Access and Usability
- These platforms present data user-friendly, making it easier for businesses to navigate complex datasets and find the specific information they need.
3. Comprehensive Insights
- Beyond mere numbers, a reliable data bank provides comprehensive insights, including market trends, competitive analysis, and predictive outlooks, enabling businesses to understand the broader context of trade data.
4. Time and Resource Efficiency
- Instead of countless hours gathering data from disparate sources, a trusted data bank offers all the necessary information in one place, significantly saving time and resources.
5. Expert Support and Guidance
- Reputable data banks often provide expert analysis, support, and guidance to help you interpret the data correctly and make informed decisions based on your findings.
6. Customisation and Flexibility
- Many platforms offer services tailored to your needs, whether looking for detailed information about a particular market segment or comprehensive global trade data.

How The Trade Vision Elevates Your EXIM Business
The Trade Vision (TTV) stands out as a premier platform in international trade, offering comprehensive tools and resources tailored to enhance your Export-Import (EXIM) business operations. Here's how TTV provides you with a definitive competitive edge:
- Data-Driven Insights: With TTV, expect a 56% improvement in decision-making capabilities, driven by access to precise and comprehensive import export trade data.
- Cost Reduction: Experience a 41% reduction in operational costs through TTV's accurate EXIM data, minimising risks and informing strategic procurement and sales.
- New Revenue Streams: Unlock the potential for revenue growth by tapping into new markets and customer segments, guided by TTV's extensive market intelligence. The insights from export import data by country help you identify and capitalise on emerging opportunities.
- Unlimited Access: Benefit from unlimited shipment views, connecting you with new buyers and suppliers in over 200 countries under a single subscription, making it the most economical tool for your EXIM business. This feature is particularly beneficial for those looking to expand their network and find import data of a company or export data.
- Efficiency and Ease: The platform's user-friendly interface and simplified data analytics reduce stress and save time, allowing you to focus on what you do best. This feature ensures that navigating through vast amounts of export import data bank becomes a seamless experience.
- Competition Monitoring: Stay informed about your competitors' business moves with regular alerts and notifications, helping you stay one step ahead.
- Direct Contacts: Easily connect with buyers and sellers of your products with provided contact details, including names, telephone numbers, email IDs, and social media profiles.
Conclusion
By leveraging the power of import export trade data, businesses can gain a strategic advantage in the global market. Whether you're a seasoned trader or new to international commerce, understanding how to access and use this data is vital to navigating the complexities of global trade. With the right tools and knowledge, you can unlock valuable insights and drive your business towards greater success in the international arena.
FAQs
Q1. How can I ensure the accuracy of the import export data I use?
Ans: To ensure data accuracy, always use reputable and verified sources, cross-reference data when possible, and stay updated with the latest data releases and revisions from official sources.
Q2. Can I access real-time import export data?
Ans: While most import export data banks update their information regularly, real-time data may not be available due to the time required for data collection and processing. However, some private data providers offer near real-time data services.
Q3. How can import export data benefit my business strategy?
Ans: Import export trade data can help businesses identify new market opportunities, monitor competitors, track industry trends, and make informed decisions regarding product development, marketing strategies, and investment planning.
Q4. What are the common challenges in interpreting import export data?
Ans: Challenges include:
1. Dealing with large datasets.
2. Ensuring data accuracy.
3. Understanding the legal and regulatory context of trade data.
4. Effectively analysing and visualising the data to extract meaningful insights.

What Is International Trade: Everything You Need to Know About Its Types and Importance
13 Feb, 2024
0
International trade is crucial to the world economy because it affects how countries grow and progress. In this blog post, we will look into the fundamentals of what is international trade, explore the reasons behind its occurrence, highlight its numerous benefits, discuss the various types of international trade, and explore the easy access facilitated by e-commerce.
What is International trade?
International trade refers to exchanging goods, services, and capital between countries. It enables nations to obtain products that are not available in their domestic markets and allows them to specialise in producing goods and services in which they have a comparative advantage. This specialisation leads to increased efficiency and productivity, benefiting both trading partners. Countries can expand their markets, strengthen interdependence, and promote economic growth worldwide by engaging in international trade.
Why does International trade happen?
International trade occurs due to various reasons:
- Resource disparity: Different countries possess unique resources, such as natural resources, labour force, or technological expertise. International trade allows nations to tap into these resources best using their comparative advantages.
- Economies of scale: Larger scale production often decreases costs. International trade helps countries to access bigger markets. It allows firms to use economies of scale and achieve greater cost efficiency.
- Market access: Countries can access a broader range of goods and services by engaging in international trade. It leads to enhanced consumer choices and increased purchasing power.
- Political considerations: International trade can be a diplomatic tool to foster positive political relationships between nations. Trading partners develop interdependence, reducing the likelihood of conflicts and promoting stability.

What is the Importance of International trade?
International trade offers numerous advantages contributing to countries' economic growth and development, making it extremely important. Some of the key benefits include:
- Increased economic efficiency: One way for countries to improve their economies is to specialise in making the things and services they can do best. This specialisation leads to higher productivity, lower costs, and improved living standards.
- Enhanced consumer choices: International trade expands the variety of goods and services available in domestic markets, giving consumers a wider range of options. It allows individuals to access goods that are not produced domestically, leading to greater consumer satisfaction.
- Greater competitiveness: Engaging in international trade exposes domestic industries to competition from other countries. It drives innovation, encourages the adoption of new technologies, and forces businesses to strive for higher quality and efficiency.
- Investment opportunities: International trade attracts foreign direct investment, which leads to economic growth. When companies invest in foreign markets, they create jobs, transfer knowledge and technology, and contribute to the development of local industries.
The importance of international trade lies in its ability to stimulate economic growth, diversify markets, and increase global cooperation.
What are the types of International trade?
International trade can be classified into different types based on the nature of exchange or the trade mode. Some of the common types of international trade include:
- Export trade: It involves the sale of goods and services produced domestically to foreign markets.
- Import trade: When things and services are bought from foreign markets and used in the home country, this is called import.
- Re-export trade: It entails the export of goods that were previously imported. These goods undergo little transformation and are exported to different markets.
- Bilateral trade: It occurs when two nations engage in mutual trade, buying and selling goods and services to each other.
- Multilateral trade: Multilateral trade involves multiple countries engaging in trade with one another. It is facilitated through free trade agreements and regional trade blocs.
Easy international trade via e-commerce
With the advent of technology, international trade has become more accessible and efficient. E-commerce platforms have revolutionised how businesses operate, eliminating geographical barriers and connecting buyers and sellers from around the world. According to NASSCOM, the amount of Indian exports that are led by online sales will likely grow 45 times by 2030. Through online marketplaces, small and medium-sized enterprises can now engage in international trade at a much lower cost, reaching a global customer base. This convenience has democratised international trade, fostering entrepreneurship and economic growth worldwide.
Conclusion
International trade catalyses economic growth, allowing countries to reap the benefits of specialisation, expand their markets, and foster interdependence. The Trade Vision revolutionises international trade by offering innovative perspectives on export-import trade. This platform is a goldmine for companies that want to do well in global markets because it has a lot of international trade data on the value, price, and amount of goods traded. It's not just collecting data; it's turning numbers into strategic insights that help businesses make more money, cut costs, and take advantage of good chances to stay ahead of the competition. The Trade Vision covers more than 200 countries, and its detailed analytics and personalised dashboards give you actionable information at your fingertips. Use the power of The Trade Vision's export-import data and tools to take your business to new heights.
FAQs
Q1. Why is international trade important?
Ans: International trade is vital as it allows countries to specialise in producing goods and services they have a comparative advantage. It contributes to economic growth, enhances consumer choices, promotes innovation, and fosters international relationships.
Q2. What is the significance of data in international trade?
Ans: International trade data provides insights into trade patterns, volume, and value between countries. It helps identify emerging trends, monitor trade balance, and evaluate industries' competitiveness.
Q3. How can I engage in international trade as an individual?
Ans: As an individual, you can participate in international trade through e-commerce platforms. Selling products online or providing services globally can be a viable option, allowing you to tap into a global market.
Q4. What are the risks associated with international trade?
Ans: International trade carries certain risks, including political instability, currency fluctuations, trade barriers, and economic downturns. Businesses engaging in international trade must carefully assess and manage these risks to ensure smooth operations.

Providing the Best Import-Export Data for Global Trade
13 Feb, 2024
0
When it comes to international trade, access to reliable and comprehensive data lays the foundation for success. Businesses and traders need accurate information to make smart choices and stay ahead in a competitive market. This article looks into the significance of maintaining a robust import exportdatabase, understanding the impact of international trade imports and exports data on a nation's economy, and identifying the best website for import export data. Let's begin this informative journey, which not only answers your most pressing questions but also provides a roadmap to successful trading strategies.
Why Maintain an Import Export Database
Our world is marked by diverse cultures, needs, and production capabilities; no single country can cater to all the preferences and demands of its population. This diversity necessitates international trade, allowing nations to import goods and services to meet their citizens' varied needs. Conversely, countries often produce certain goods over domestic demand, allowing them to export these surpluses to markets where they are in demand. This perpetual flow of imports and exports forms the backbone of global trade, necessitating a well-structured import export database to meticulously track every transaction.
A well-maintained import export database serves multiple crucial functions:
- Transparency: Ensures every transaction is recorded, promoting transparent trade practices.
- Strategy Formulation: Helps traders and policymakers analyse trends, formulate strategies, and make informed decisions.
- Regulatory Compliance: Aids in adhering to international trade regulations and standards.
Why do Businesses Need International Trade Imports and Exports Data?
The health of a nation's economy is linked to its trade practices. A fundamental principle for economic prosperity is maintaining a positive trade balance where the value of exports surpasses that of imports. This balance ensures a net capital inflow, bolstering the nation's economic standing. However, achieving and maintaining this balance requires access to reliable international trade imports and exports data, guiding businesses to strategise effectively and maximise profitability.
Moreover, a deep understanding of various legal frameworks, including tariff codes, customs duties, and trade agreements, is essential in ensuring success in global trade. The role of a comprehensive import export database becomes indispensable.

Finding the Best Import Export Database Provider
When searching for the best website for import export data, consider these essential factors:
- Accuracy: The data must be precise, current, and reliable.
- Comprehensiveness: The database should cover a wide range of products, countries, and trade metrics.
- User-Friendly Interface: The platform should offer easy navigation and data retrieval.
- Analytical Tools: Availability of tools to analyse trends, generate reports, and predict market behaviours.
Who Leads the Market in Providing Reliable Import Export Data?
One name stands out for reliability in global trade: The Trade Vision (TTV). TTV distinguishes itself by offering unparalleled access to country-wise international trade data from around 200 countries. With TTV, businesses are not just receiving data; they're gaining a comprehensive view of the global market. The platform's strength lies in its ability to provide the most accurate and detailed information about profitable buyers, suppliers, potential markets, and high-demand products. This wealth of information opens doors to new markets and lucrative business opportunities, setting TTV apart as the leading provider of import export data. With the exporters' database and other vital information at their fingertips, businesses could predict market shifts with greater precision, making strategic decisions that propelled them ahead of their rivals.
Why Opt for The Trade Vision for Comprehensive Trade Data?
Choosing The Trade Vision (TTV) for your import export database requirements means the ability to make informed and strategic decisions. TTV is not just a data provider but a partner in growth, offering export-import trade intelligence that encompasses the value, price, and quantity of merchandise traded between countries and their trading partners. Here's why TTV stands unparalleled:
- Global Market Intelligence: TTV covers over 200+ countries, turning vast export-import data into actionable business insights. It helps organisations grow revenue, gain a competitive edge, reduce costs, and seize new business opportunities.
- Expert-Driven Insights: TTV's 15 years of experience, accompanied by a team of top statisticians, exporters, and importers, provide data that boost decision-making ability by 56%. The insights offered are not just numbers but a roadmap to smarter, timely business decisions.
- Customized Dashboard Reports: The dynamic and user-friendly dashboards allow for an easy understanding and visualisation of critical indicators and strategic information. This level of customisation and clarity can enhance customer acquisition by 40%.
- Data-Informed Decision Making: TTV recognises the challenges organisations face in managing and processing vast volumes of trade data. The platform empowers Export-Import businesses and individuals to make smarter decisions by uncovering hidden insights and transforming data points into meaningful insights.
- Trusted Global Network: With a global clientele of over 20,000, TTV's reputation as the most trusted information network for the Exim Community is solidified. Clients worldwide rely on TTV's experience and expertise to succeed and prosper in international trade.
Conclusion
To be good a timport export databases, you need to do more than just gather a lot of data. It's about understanding how global trade flows are constantly changing, accurately predicting market trends, and making wise decisions that fit how the economy is continually evolving. Additionally, it includes using business intelligence and data analytics to turn raw numbers into insights that can be put into action. It might seem hard to find your way around the complicated world of international trade. Still, traders and countries can do it with trust and accuracy if they have accurate and complete information. Ultimately, the mastery of data is not just about insight—it's about foresight, enabling you to keep pace and stay ahead in the dynamic of global trade.
FAQs
Q1. How can an accurate import export database benefit traders?
Ans: Accurate data empowers traders to make informed decisions, understand market trends, predict future trade patterns, and formulate robust strategies, thereby minimising risks and maximising profits. The traders can identify emerging markets by analysing the exporters' database and adapting their strategy to tap into new opportunities.
Q2. What are the consequences of neglecting the maintenance of an import export database ?
Ans: Neglecting database maintenance can lead to uninformed decision-making, compliance issues, and potential financial losses due to outdated or inaccurate data.
Q3. How can one ensure the reliability of animport-export dataprovider?
Ans: Verifying the best website for import export data involves checking their data sources, user reviews, the frequency of data updates, and the analytical tools they offer to make the most of the data.
Q4. How can access to a detailed import export database drive business growth?
Ans: Access to a detailed import-export database can significantly drive business growth by providing deep insights into global market trends, buyer and supplier behaviours, and potential new markets. It allows businesses to make data-driven decisions, tailor their strategies to meet market demands, and ultimately expand their footprint in the international trade.
Q5. What advantages does The Trade Vision offer in managing import export data?
Ans: The Trade Vision (TTV) offers a suite of advantages for managing import export data efficiently. With its comprehensive coverage of over 200+ countries, expert-driven insights, and customized, easy-to-understand dashboard reports, TTV empowers businesses to make informed decisions.

The Future of Chemicals Export Import: Embracing Digitalization and SustainabilityIndia Export Trend
Opportunities
30 Nov, 2023
0
The Indian chemicals industry is among the largest in the world in terms of both sales and imports. It stands at $180 billion as of 2020, and is projected to reach $304 billion during 2025. The country produces a wide range of chemicals from bulk chemicals to petrochemicals, agrochemicals, polymers, fertilizers, specialty chemicals and even pharmaceuticals. Seventy percent of this production is consumed domestically while the remaining 30% finds its way into exports. Bulk chemicals constitute 25 percent of the market share whilst specialty chemicals, petrochemicals & agrochemicals each have 21%, 15% & 19% respectively and biotech & pharmaceuticals (including active pharmaceutical ingredients) together make up 20%.
India's chemical industry provides employment for millions as well as raw materials for many industries ensuring economic development in all sectors nationwide. Companies are continuously researching new products that will be cost competitive yet We are rewarded with sustainable long-term growth across all regions — further increasing the potential of India’s chemical sector over other global competitors. A favorable regulatory environment coupled with technological advancements has enabled a conducive atmosphere for businesses to thrive making it an ideal avenue for investors too.
India Export Trend
India's rise to being one of the top chemical exporting countries in the world is a result of dedicated efforts from both government and trade organizations like CHEMEXCIL, India's Chemical Exports Promotion Council. Since FY23 (until September 2022), exports of major chemicals and petrochemical products have stood at US$ 8.6 billion as a result of subsidies granted by the Department of Commerce & Industry, and B2B exhibitions organized throughout different countries. Through these efforts, small and medium exporters from key states like Gujarat, Maharashtra, Karnataka, Tamil Nadu, and Andhra Pradesh have seen tremendous growth in their industries.
Compared to other nations, India fares better when it comes to navigating through international trade-related issues such as high freight rates or container shortages. This due mainly to the initiative taken by CHEMEXCIL which provides financial aid in statutory compliance in overseas product registration in order to sustain market access worldwide despite any obstacles that may arise. As such, this growth has been made possible with its relentless efforts towards increasing transparency and promoting ethical business practices among its members exporters.
Opportunities
The specialty chemicals segment has seen a huge growth rate of 12 percent, increased mainly due to the rising use of hygiene products, packaged foods, energy drinks and nutraceuticals. These sub-sectors consist of flavors and fragrances, personal care chemicals, nutraceutical ingredients, and surfactants. This leads to many opportunities for U.S companies to export chemicals with applications in agrochemical, seed treatment pharmaceuticals industries while India is looking at importing technologies such as acetic acid, acrylonitrile and lithium-ion battery production.
From the construction industry to automotive services and water treatments industries, there is a potential for great further growth in this segement due to increasing demand internationally. With regards to U.S exporters there are immense chances in areas such as adjuvants; enzymes or plant based extracts useful for household care; probiotic and keratin actives; conditioning actives; and glutathione for personal care products. All these factors represent promising development opportunities that should not go unnoticed by businesses belonging in this sector of the market
Chemicals Export / Import Regulation
The Export-Import or Prior Informed Consent (PIC) Regulation (EU) No 649/2012 is a law that places specific obligations on exporters of hazardous chemicals to non-EU countries. The law seeks to help countries monitor and control the export and import of these potentially dangerous substances, as well as enabling them to refuse and impose restrictions upon their acceptance. The purpose is to ensure safety over these toxic materials. Under the regulation, exporters must obtain prior informed consent from those importing hazardous chemicals, meaning they require permission from the government of the country they are transporting the materials into. They must also provide appropriate safety information for those using the materials within that country.
The regulation outlines requirements related to notification, labeling and packaging, emergency response measures and end use obligations for these potentially hazardous substances. All exporters must comply with this legal standard in order to protect human health and environment, as well as meet certain economic interests of international trade along with other involved states’ laws and regulations. For further information on exporting and importing regulations under PIC Regulation (EU) No 649/2012 please visit our homepage for details.
Conclusion
The chemicals export import industry plays a vital role in the global economy, providing essential goods and services to various sectors. The industry faces numerous challenges, including complex regulations, environmental concerns, and changing global trends. However, it also presents significant opportunities for growth and innovation.

The Role of India in the Iron and Steel Export Import Market
2 Nov, 2023
0
The history of India's steel industry is closely tied to its independence in 1947, when it was comprised entirely of private sector firms. This all changed with the first Five Year Plan introduced in 1952, which imposed a number of restrictions and effectively placed the sector under state control. Large-scale expansions in steelmaking capacity were reserved for public sector enterprises, and the Indian Government controlled the prices set by large producers, while also placing quantitive restrictions and tariffs on imports of inputs and finished steel. This government intervention helped steel production grow strongly from 1950 to 1970, with average annual growth exceeding 8 per cent over that time period.
Steel Trade and Demand
Steel is an important part of India’s manufacturing and construction industry, with finished steel production accounting for a substantial portion of both industries. Construction and infrastructure are estimated to account for around 40 per cent of steel consumption, while manufacturing in sectors like automobiles make up the remaining 30 percent. Recently, India has become a net importer of steel as domestic demand has grown significantly propelled by strong growth in Indian Steel consumption. Imports have been especially high for flat products that are used in the manufacturing sector due to its growing importance before and after the global financial crisis. Despite the large interest in imports, exports continue to be vital for India’s economy with it accounting for 4% of total export value in 2010. This reflects on the importance that Indian companies have placed on producing many types of pipes and tubes which can be exported easily. In conclusion, India’s connection to the steel market proves to be integral both domestically and internationally as its use presents unique opportunities within different areas concurrently.
India exports iron and steel for what reasons?
India is the world's largest exporter of iron and steel, with a total exports value of US$26.81 billion in 2020 according to the Indian Trade Ministry. This export volume is driven by India’s growing steel industry, which is one of the largest in the world. The nation has abundant iron ore resources, low labour costs and a skilled workforce which give it a competitive advantage in terms of cost competitiveness over other producers. In 2022, India produced 125.32 million metric tons of crude steel - up 4.2% from the previous year - making it the second-largest crude steel producer in the world after China.
The export market for Indian iron and steel products is largely dominated by developed countries such as U.S., France, Germany and Italy; but due to its low production costs, Indian steelmakers have been able to find success in exporting their products to many markets around the globe, including Africa, Asia and South America. India’s exports are expected to continue rising as demand for quality low-cost steel products drives expansion into new markets, fueling further growth opportunities for domestic producers.
India's Iron & Steel Sector: Top Sources of Supply
India's steel industry is one of its major drivers of economic growth and development, making it a natural choice for export. India has an abundance of iron ore resources which allows steel to be produced at competitive prices compared to other nations. Coupled with relatively low labor costs and a skilled workforce, this makes India an attractive option for countries looking to source their steel requirements in a cost-efficient manner. Furthermore, the Indian steel sector is performing very well globally and is expanding quickly. In 2022, India recorded the highest production of 125.32 million metric tons of crude steel in its history, indicating the strength and potential of Indian manufactured steel in domestic as well as global markets.
The advantages that Indian production holds over those from other countries, such as cost-efficiency and availability of resources, creates an ideal environment than can be used by a wide range of industries, including automotive, engineering and construction. By exporting Iron and Steel products made in India abroad, the world not only gets access to excellent quality material but also becomes more aware of Made-in-India product standards—allowing Indian companies to establish stronger international relationships built on trust. This is why India exports iron and steel; so as to not only make profitable investments but also become a India is known to be the largest exporter of Iron and Steel in the global market. This is due to India’s large and growing steel industry, which produces 125.32 million metric tons of crude steel as of 2020, making it the second-largest crude steel producer in the world. The country has many advantages that allow its steelmakers to produce steel at a significantly lower cost than its competitors in other countries. These include access to abundant iron ore resources, a relatively low labour cost and skilled workforce.
India’s competitive advantages also enable it to sell its products abroad at competitive prices while still turning a profit. This has made India an attractive export destination for other countries looking to purchase high quality iron and steel products, spurring more exports from the country every year. India’s export of iron and steel has allowed it to become a major player in the global market and bolster its overall economic growth.
Factors Boosting India's Exports of Iron and Steel
India is one of the leading exporters of iron and steel across the globe, and this growth and success can be attributed to a number of factors. Firstly, India has seen large investments in modern infrastructure projects that promote global trade and enhance the productivity of local industries. This boosts efficiency, ensuring cost-effective production processes with reduced wastage for effective international delivery. Furthermore, low-cost labor forces have enabled Indian markets to compete prices effectively on products such as steel billets which are commonly used in automobile manufacturing.
Moreover, India has an abundance of natural resources for raw material supplies – iron ore deposits in particular – which helps to maintain competitive production costs while also allowing export diversity through a variety of processed products from mid-size manufactures. Furthermore, attractive tariff plans are becoming increasingly important to encourage India’s exports, namely free trade agreement such as those with Korea and Japan that ensure continued exports for producers at competitive rates. Finally, India benefits from established relationships with its trading partners who impose no strict quotas or tariffs on Indian imports while remaining proactive about their best interests. All these elements combined contribute to the continuing success and profitability enjoyed by Indian exporters within the iron and steel industry.
India's steel imports surge in June 2023, Shares are dominated by China and Vietnam
India's steel import surged in June 2023, with increased shares from China and Vietnam. According to the Ministry of Steel, India's steel imports rose by 5.9% month-on-month and 7.6% year-on-year to reach 4.84 LMT during the month, demonstrating a growing demand for imported steel. This was despite India's steel exports registering a 21.3% y-o-y decline for the same period.
The share of countries such as China and Vietnam also went up significantly in India’s import basket during June 2023 when compared to previous years, while iron ore prices remained largely unchanged at the same time. The surge in imports illustrates a broadening appetite for foreign steel products in India due to their ease of availability and wide range of specifications available across various price points. As such, this trend is expected to sustain over the upcoming months as domestic demand continues to strengthen.

Oil and Gas Import Export: A Closer Look
30 Oct, 2023
0
Oil and natural gas are fossil fuels, formed from decayed prehistoric organisms, that have been underground for millions of years. These energy resources are invaluable to society, powering homes, fueling transportation, and providing raw materials to produce everyday items.
Oil is found in liquid form while natural gas is found in gaseous form. Oil can be used to generate electricity and creates useful byproducts such as gasoline, diesel fuel and petrochemicals. Natural gas is used for cooking, heating homes and businesses as well as providing electric power if configured properly. Additionally natural gas may also fuel vehicles as it produces fewer emissions than oil or other fossil fuels when burned. Overall, both oil and natural gas provide high-value energy resources that can help meet a country's current needs without compromising future generations’ ability to enjoy their benefits.
Import Export of Crude Oil and Gas
The import/export of crude oil and petroleum products is an important indicator of the overall health of a nation’s economy. Oil and Gas export import data offers insight into the international flow of goods within one month period. For example, in April 2020 over 20,000 barrels of crude oil were imported while very few barrels were exported. On the other hand, Liquefied Petroleum Gas (LPG) was heavily exported with over 14,000 barrels being transported over the same period. The month also saw no import or export activity for Automobile Fuel Oil (MS) and Aviation Turbine Fuel (ATF).
Looking at the total annual figures from January to March 2021 shows that most imports and exports increased across sectors compared to previous years. Notably, there was an 11% increase in Naphtha exports during this period and a significant jump in imports for LPG which were more than triple what was seen in 2020. Such revelations show how global commodities influence energy prices as well as provide insight on current trends in both international business and geopolitics.
U.S. poised to become net exporter of crude oil
The United States is currently the world’s leading player in the crude oil industry, with a record 3.4 million barrels of oil exported daily and 3 million barrels of petroleum products such as gasoline and diesel fuel. This all may change in less than a year however, as the US is set to become a net exporter of crude oil for the first time since World War II. The surge in exports comes at an opportune time considering the price pressure that global supply has felt due to burgeoning demand from fracking operations.
This shift will have a major effect on US energy policy going forward and could create jobs previously unimagined down the line. It also provides options for foreign companies looking to substitute out-priced Russian and Saudi crude for cheaper American varieties which may support our geopolitical interests abroad without pushing us further into conflict. Looking ahead, events like these are why analysts have dubbed 2020 “The Year of American Energy Exports” indicating that we are poised to be an even more terminal force in global geopolitics moving forward.
Conclusion
The global oil and gas import and export market is a complex and dynamic one, but it is also a vital part of the global economy. By understanding the key trends and insights shaping the market, businesses can make informed decisions that benefit all stakeholders.

Cotton Exports from India: A Booming Market with Global Implications
27 Oct, 2023
0
The cotton industry continues to play an important role in India’s economy, with a significant portion of its exports coming from the textile sector. In FY23 alone, exports of cotton yarn were valued at US$ 2.75 billion and those of cotton fabrics and made-ups came to US$ 6.81 billion according to the Office of the Textile Commissioner.
The importance of cotton exports cannot be overstated, as they help provide much needed foreign currency for India’s growing economy. Additionally, the expansion of this industry not only boosts jobs in rural areas, but also elevates the status and employment opportunities for women who comprise a large majority of laborers working in the production lines. By shifting focus to domestic production instead of relying on imports, Indian farmers have been able to earn higher incomes due to greater demand for their locally grown produce.
Cotton Export by India
India is one of the world’s leading exporters of cotton with some 159 countries importing their goods. Bangladesh, China and Vietnam are key importers of cotton from India, collectively making up roughly 60% of exports from the country throughout 2021-22. Even during a devastating pandemic, exports have continued steadily at pace and prove to be an increasing part of India’s economy.
China has been responsible for the second-largest amount of imports from India, taking up around 80% of Indian supplies annually. Vietnam and Indonesia also make up a large fraction of imports coming in from India, with 15%, alongside other smaller countries like Australia, Turkey and Jordan. Beyond producing for internal markets, cotton export Fort Indian economy is an important activity which will spur growth in 2021-22.
How to start Cotton export business from India
Obtain necessary licenses and registrations
• The first and foremost step when it comes to exporting cotton and its allied products from India is obtaining the necessary licenses and registrations. An Import Export Code (IEC) is a compulsory requirement for shipment of goods, in addition to Registration Cum Membership Certificate (RCMC) and Goods and Services Tax (GST) registration for having a business presence in India.
• It is also important to identify the target market and customers for Cotton products before starting export operations.
• In-depth market research should be carried out to understand the dynamics of the demand, competition, as well as study the regulatory norms of the foreign countries associated with the import of Cotton products.
• This helps businesses better leverage their marketing strategies and resources towards achieving their goals suited for each market’s specific needs.
Identify the market and target customers
Apart from being legally compliant, exporters must prioritize quality of Ivanovial Quick Release Cotton Hook those Cotton products in order to stay competitive in respective international markets. Proper labeling requirements ensure traceability and safety standards are met while robust supply chain management ensures expedited delivery times to buyers abroad. Reputable certification organizations such as ISO14001and SA8000 provide further proof that quality standards have been observed during production process. Therefore, by committing to stringent product quality protocols right from sourcing raw.
conclusion
Cotton exports from India play a vital role in the global cotton market. India is the world's largest cotton producer and exporter, accounting for around 25% of global cotton exports. The Indian cotton industry is a major source of employment and income for millions of people in rural India.

How to Export Sugar from India
23 Oct, 2023
0
The increased demand for sugar on the global market has proven extremely beneficial to India's sugar industry. Numerous government policies have been put in place to increase the production of sugar, which in turn has resulted in increased exports. Today, India is the second-largest sugar exporter in the world and is both the largest producer and consumer of sugar.
Besides increasing production output, one of the main reasons why India’s export of sugar has seen an upward trend is due to initiatives that have been created by the government, such as aiding ethanol production within the country. For this reason, a lot of licensing processes and regulations must be followed by exporters before any shipment takes place, also ensuring safety precautions are taken when exporting sweet beverages that contain added sugars. As a result, we witness a remarkable growth within India’s industry, opening up numerous opportunities for those who wish to benefit from it.
Sugar Types that Can Be Export
Sugar is an essential commodity, and there are many types of sugar that can be exported.
White Sugar:- White sugar is the most common type of sugar used in various recipes and food preparation. It is a granulated form of sucrose, which has a light color and odorless taste.
Organic sugar: Organic sugar is also available for export, and it is made through evaporated cane juice from organic crops to create pure cane sugar crystals.
Brown sugar: Brown sugar has a golden-brown appearance due to it containing molasses; it can be in either light or dark varieties, with the darker variety containing more molasses than the light variety.
In addition to these more well-known varieties of sugars, there are also a range of specialty sugars that can be exported, such as Sucrose AR & LR and other sucroses ideal for pharmaceutical use like IP/BP/EP/USP/JP that conforms to specific legal standards. These kinds of specialty sugars are used extensively in medical industries as well as etc. All these types of sugars offer different characters and should be considered depending on the intended use when exporting them internationally. Exportable grades may differ by country, so careful research should be done prior to exporting a particular kind of sugar product in order to ensure.
Procedure for Exporting Suger Outside of India
The export of sugar and sugar confectionery (including white chocolate, but not cocoa) requires an applicable HS Code. Depending on the type of sugar, these codes can range from 1701–1704. A separate HS code (2303) is for the waste of sugar manufacturing, the residue of starch manufacturing, and other similar residues. These goods must have a clearly visible shelf life on the package they are to be exported with.
In addition to HS Codes, exports of sugar must comply with requirements mandated by Food Safety and Standards Authority of India (FSSAI). This involves ensuring a food symbol is present on the package as well as providing necessary quality control measurements such as brand name, method of preparation, organization or company name, FSSAI logo and FSSAI license number among others. All export-bound packages are required to bear manufacturing date, expiry date, lot number, batch number and net quantity.
Documentation needed for Sugar Exports Outside of India
Exporting sugar products from India requires detailed documentation to ensure that the process is legally compliant. Under the Export and Import (EXIM) Policy, all merchandize must be registered with the Directorate General of Foreign Trade (DGFT). This process requires an Import Export Code (IEC), which has to be obtained by a company registered in India. Additionally, the exporting organization needs to have release orders (EROs) from their customers.
The process of documentation also includes an export invoice containing details about the product being exported, such as quantity, item description, invoice number, date of exports and its intended destination. Furthermore, an export packing list has to be included in all shipments stating details on quantity per package as well as type and size of boxes. If goods are organic or certified-organic then separate authorization from APEDA is required before shipping them abroad. Hence, sufficient paperwork is essential for efficiently executing the entire procedure and ensuring its compliance with related laws both in India and the destination country.
What is the Status of Sugar Exports?
The growth of India's sugar exports over the past few years has been nothing short of impressive. Out of India's 110 lakh tonnes of sugar exported in 2021-22, raws alone accounted for 56.29 lakh tonnes, making it one of the largest raw sugar exporters in the world. This trend is mainly attributed to Indian raw sugar being free of dextran, a bacterial compound, and having higher sucrose content compared to other producers like Brazil, Thailand and Australia. Additionally, it is also easier and cheaper to refine Indian raw sugars due to its high polarization values (98.5-99.5%.)
However, with domestic availability becoming an issue this year due to lower stocks and production dipping, the government has capped India's exports in 2021-22 at 61 lakh tonnes. While this was necessary for food inflation control and ensuring domestic availability of sugar, what could be more detrimental than losing overseas markets when they are lost? Providing ways to secure these markets should be a priority if India wants to continue making progress in terms of export numbers anytime soon.
Conclusion
Exporting sugar from India can be a rewarding business opportunity, but it is important to be aware of the regulatory environment and to take the necessary steps to ensure compliance. By following the tips above, businesses can increase their chances of success in the global sugar export market.

Unveiling the Global Coffee Export Market: Insights and Trends
13 Oct, 2023
0
Coffee is a popular beverage across the world, with a market that reaches revenues of US$88.3bn in 2023. The global coffee market is expected to grow annually by 4.61% (CAGR 2023-2028). In terms of global revenue, the United States is a major player as this country alone will account for approximately US$11,000m of total sales in 2023. When comparing these figures to the global population, it can be estimated that each person will generation an average of US$11.50 in revenue this year from coffee consumption. Furthermore, Global production of Coffee is expected to reach 6.8bn kg by 2028 with most of it being exported abroad according to industry reports.
The global demand for coffee is increasing and its consumption seems universal worldwide which explains why its popularity has reached such heights as well as its growing economic value globally. As this increase in demand continues, farmers across the developing countries are increasingly devoting more land and resources towards cultivating better quality coffee beans for larger markets while at the same time aiming to improve their overall harvesting procedures However at present there remain important supply chain gaps and efficiency issues that need to be addressed providing an opportunity.
2022 Coffee Export Trends
The global coffee export industry has seen extraordinary growth over the past five years. The year 2022 marked a tremendous success on the international stage, as coffee exports amounted to an astonishing $46.3 billion. This impressive 51.7% surge in export value since 2017 is indicative of consistently rising demand for an increasingly wide variety of coffee products from all around the world.
The success of the industry’s trade growth can be attributed to multiple factors, with one being the undeniable and ever-growing love affair between customers and their morning cup of joe. Indeed, coffee has become a beloved beverage that transcends cultures and geography — it pairs well with breakfast but acts also as a catalyst to economic progress. It is without doubt that if coffee continues its meteoric rise in terms of popularity and demand, then it will remain at the very top of world exports for years to come.
Top Coffee Exporting Companies
Coffee is one of the world’s most popular commodities, yet ironically, the countries producing and exporting it often receive little benefit from their efforts. This is largely due to a large portion of profits going to supply chain middlemen and big roaster conglomerates. Nonetheless, there are still many coffee exporting companies which operate in producer countries through joint ventures with local middlemen.
Barbera Coffee Company: Barbera Coffee Company located in Italy. Founded by Antonio Barbera over 100 years ago, this family-run coffee business has grown to become one of Europe’s leading coffee exporters, as well as a top supplier of green beans for speciality markets.
Coffee Cabana Brazil: Coffee Cabana Brazil located in Brazil. It offers a wide range of specialty coffees cultivated and produced in its own farmlands alongside select partners across the country. These two companies represent just a few examples of numerous coffee trading companies providing quality green coffee beans at competitive prices while also helping to support their local communities.
Conclusion
The global coffee export market is a vital part of the global economy, and it is expected to continue to grow in the coming years. Businesses and policymakers that understand the key trends and insights shaping the market will be well-positioned to benefit from this growth.

The Future of Pharmaceuticals & API Export-Import: Technological Innovations and Forecasts
17 Sep, 2023
0
Things are changing faster than ever. As people are struggling to keep up, foresight and adaptation become essential to success. This is just as true for the pharmaceutical industry and the trade of its products across borders.
When the average drug used to take twelve years to develop, scientists rushed to make a vaccine in just one year during the pandemic of 2020. According to our pharmaceutical import export data, the industry shows no signs of stagnation. Let’s take a look at the most promising technologies that are expected to shape the future.
The Trade Vision is a premier data provider and market intelligence company with decades of experience in import-export statistics. Access our data on the go with comprehensive reports from over 100 countries.
AI-Powered Research & In Silica Experiments
R&D is a crucial part of the drug development process, without it, there would be no pharmaceuticals. It is also the most problematic. It takes billions of dollars before a new drug can be made. On top of all that, the process can take up to a decade or more.
The rise of powerful AI models has created a ripple across all industries. While many people fear losing their jobs, affordable AI is practically a Godsend for pharma developers. Using these software, companies can cut down the research time from decades to just a few days while saving billions.
Big pharma was quick to see the potential as well. Atomwise would be a good example of this. The biotech company discovered two potential treatments for Ebola back in 2015 using AI.
In vivo is Latin for “within the living organism.” This term is used for tests and experiments that are run on living organisms during drug development. With advancements in computer technology, we are coming closer to more accurate virtual models for organs and human bodies. Reliable information from such software can become another influential factor in the industry.
Patient Design
Medicines can hardly be considered consumer products. Due to their necessary nature, traditional developers have often gotten away with the bare minimum. After all, medicines are supposed to get you out of the critical zone, above anything else. Yet, technological advancements are changing that by bringing up the bar.
Here’s where patient design comes in. As health issues become more common and easily identified, patients are coming together for better solutions. One example of this is a few years ago in the US when diabetic people started making DIY artificial pancreas.
After hundreds of multi-field professionals came together to build this solution, regulatory bodies caught on. The FDA approved and developed a more standard version than the original open-source DIY one.
The takeaway is that with better monitoring tech and online communities, the focus is slowly coming to the end-user experience. Regulatory bodies all over the world have set up channels for faster development of drugs and innovative products.
What To Expect
The influence of these technologies on the pharma world is expected to be the most significant by experts. Yet, it’s important to remember that these forecasts are focused on promising technology.
Each country has its own geopolitical, cultural, and economic forces that are currently shaping its pharmaceutical industry. It’s important to know the current picture, in order to understand the actual influence of these factors.

From Lab to Shelf: The Journey of Medicines and APIs in Global Trade
5 Sep, 2023
0
It’s important to be in touch with the pharmaceutical industry as an importer or exporter of medicines. A successful trader is well aware of the latest developments and opportunities in the world of medical products.
Our free pharmaceuticals import export data shows thousands of pharmaceutical drugs that are being traded all over the world. Being familiar with how new drugs are created is crucial to succeed as a pharma trader.
The Trade Vision is a premier data provider and market intelligence company with
decades of experience in import-export statistics. Access our data on the go with
comprehensive reports from over 100 countries.
Drug Development: An Overview
Pharmacovigilance is the science of ensuring the safety of medicines. Each country has its own regulatory body that takes care of this function. The actual procedure of drug development is very similar throughout the world.
The US, UK, Switzerland, Germany, France, and Europe have been leading in the development of new medicines for decades.
An average drug takes around 12 years to be developed and costs about €1.15 billion. It goes through five different phases before it is issued a license to be made available to the public.
Stages of Developing A New Drug
The process starts with the study of any particular disease or ailment. The neural and bio pathways are carefully mapped, and possible interception points or weaknesses are identified. How long this takes varies greatly depending on the nature of the disease.
Drug discovery is the second step. Here, possible molecules and compounds are identified that tackle potential targets, like genes or proteins. This stage typically takes between three to five years. Around five to ten thousand compounds are usually considered at this stage.
Then comes the testing stage, where we move from theoretical to practical experimentation. Cells, animals, and computational models are used to see if the drugs are working as expected. By now, the Active Pharmaceutical Ingredients (API) are narrowed down to about ten to twenty candidates.
Clinical Trials
The fourth step is the most prominent one, where trials begin on human beings. The trials are further split up into three phases. Phase 1 is done with between 20 and 100 healthy people to see if the drugs have any negative side effects.
Phases 2 and 3 are done with an increasing number of people, often with control groups in double-blind studies. The people in control groups are given placebos, or sugar pills, to remove any influences that may affect the outcome. After about 11 years and over 1.1 billion euros, the developer narrows the drug down to just two candidates.
Patenting and Finding Opportunities
Once a drug has passed the clinical trials, the company can submit an application for a license. This contains the research, manufacturing process, and the findings of the clinical trials within it. It's important to note that the regulatory body is involved in each step of the process.
A typical drug has a patenting period of about 20 years that stops the developer’s competitors from making use of their formula. This period allows the companies to earn back some of the money they have invested over the decade or so.
Companies are quick to file for patents for molecules that show promise early on in the research process. By the time a drug is licensed and approved, more than half of the patent period is typically over.
As a trader in this field, you need to keep an eye on patents being filed by big companies. Mull over pharmaceuticals import export data, keep a tab on the regulatory body of your target country, and study prominent companies to succeed in the pharmaceutical industry.

Medicines Unveiled: Understanding the Key Players in Pharmaceuticals and API Export-Import
4 Sep, 2023
0
In today’s dynamic economy, the pharmaceutical export-import sector serves a multitude of global trade activities that mainly consist of pharmaceuticals and Active Pharmaceutical Ingredients (APIs). These crucial API compounds form the core of drug manufacturing and are gathered worldwide to create safe, effective medications for all kinds of treatments and ailments.
Pharmaceutical export-import trade can be measured in terms of its quality, quantity, and where they are needed the most. Since medications are meant for human consumption, there is immense pressure to create secure and high-quality pharmaceuticals from key APIs after strict quality checks. Here are the top-ranking Pharmaceuticals & API Exporters and Importers around the world.
1. United States of America
In 2021, the USA was the highest ranking Pharmaceuticals and API importer and the 3rd largest exporter in the world at a record $516.65 billion. With a population of 3.31 million and counting, it is no surprise there is a rise in all-round medical necessities.
2. China
At nearly $171 billion, China ranks in second place when it comes to medicine production and trade. This East Asian country holds a majority of an aging population that survives on generic drugs and APIs. It also has stricter drug approvals than other countries making trades difficult.
3. Japan
Japan is the third largest country in pharmaceutical export-import trade. Similar to China, this Asian country also holds an increasingly aging population making it a top exporter of pharmaceuticals and APIs from the USA.
4. Germany
As the largest pharma import-export market across Europe at $64.4 billion, Germany is the biggest exporter of medicines with over 1.43 million people employed and contributes $103 billion to the pharmaceuticals and API trade.
5. Ireland
Ireland is the fifth biggest exporter of pharmaceutical products in the world at over $62.68 billion thanks to its low corporate tax systems. This brought Pfizer Inc., Merck & Co., Johnson & Johnson and more to establish their manufacturing facilities here.
6. Switzerland
Switzerland holds nearly $55.85 billion in medicine production across the world. It contributes 5% to the GDP of the country through employment and R&D.
7. France
France's markets are stringent and contribute 30% of pharmaceutical sales while they try to overtake rivals China and India in manufacturing APIs.
8. Italy
According to the 2021 medicine production reports, $44.31 billion is spent on Italy’s pharmaceutical import-export needs. This European country employs most of its population and works under the regulatory frameworks of the Italian Medicines Agency (AIFA).
9. India
India holds more than 10,000 pharmaceutical manufacturing facilities and is the biggest contributor to generic drugs in the world. It also holds the highest manufacturing approvals from the US Food and Drug Administration (FDA).
10. Belgium
The pharmaceutical and APIs industry spends nearly $1.64 billion on R&D alone which equals nearly 40% of all private investments in Belgium. It is in the top five exporters of medicine production at $34.8 billion across the world.
Ensuring quality across borders
Countries like the UK, Spain, Brazil, Canada, South Korea, and the Netherlands are also key players in the pharmaceutical export-import trade through viable environmental, economic, and social factors. In a nutshell, the pharmaceutical EXIM system is like a global teamwork. Different countries contribute, ensuring that the medicines produced are top quality for consumption.

Economic Factors Influencing Global Pharmaceuticals & API Export-Import Trends
1 Sep, 2023
0
Life expectancy has skyrocketed over the last century. Much of this can be attributed to modern medicine and the widespread availability of pharmaceutical products. The crucial role that they play in the global economy is literally a matter of life and death.
The latest pharmaceutical import export data shows that this industry had a worldwide revenue of $1.48 trillion in 2022. A majority of this came from pharmaceutical drugs. Let’s find out how these drugs are made and where they come from to understand the economic factors that shape the industry.
But first, a little about who we are.
The Trade Vision is a premier data provider and market intelligence company with
decades of experience in import-export statistics. Access our data on the go with
comprehensive reports from over 100 countries.
The Pharma Drug Manufacturing Process
A typical drug’s production starts with simple chemicals called Key Starting Materials (KSM). Intermediates and Active Pharmaceutical Ingredients (API) are then added to these KSM to take the process further.
Here, Intermediates act as catalysts or mediators, and the APIs are the components that actually treat illnesses. Excipients are substances like starch and lactose that are then added to the finished drug formula. These allow people to ingest the drugs orally.
Barriers To Production
Medicines are seen as a basic necessity rather than a consumer product, which puts a lot of pressure on companies to limit costs. Drugs sold at highly competitive prices are called Generic Drugs. These are affordable counterparts of branded treatments and make up a majority of global trade.
No matter the industry, a majority of the work is always done by a human being. So, affordable labor becomes the first necessity.
Then there’s the issue of procuring KSM. They tend to have a straightforward production method, but very few companies make their own. That’s because producing KSM can be harmful to the environment unless made in controlled environments.
That’s why it can be impossible for these drugs to be made within the borders of developed nations in a profitable way. Developed nations have strict environmental protection laws, and labor tends to be expensive as well. Hence, it’s very rare for a pharma corporation to make its pills from scratch.
A Questionable Solution
Countries like India and China have massive labor resources and used to have slack environmental protection laws. This made them the ideal location for big pharma to set up factories.
This brings us to the single most important economic factor that weighs heavily on global pharmaceuticals: the economies of scale. Simply put, it’s more profitable to produce KSM and APIs in bulk. That’s why almost all roads tend to lead back to China. The country has positioned itself as a major player from early on.
For instance, India produces about 20% of the global generic drug supply but imports around 70% of its API from China. It’s also a major worldwide API supplier but imports most of its KSM and Intermediates from China.
The Current Picture
With time, the massive vulnerabilities of this unilateral supply chain started coming to light. Questions arose about the quality of Chinese pharmaceutical products, and the country’s own environmental conditions started to deteriorate.
China’s legislature has been focused on more sustainable production for the past decade. Unfortunately, the producers are quite spread out, and the process of improvement has proved slow and challenging.
The country’s severe pandemic restrictions and zero-Covid policy were the final nails in the coffin. The massive strain it put on the global supply chain was alarming to everyone. Companies all over the world are responding by diversifying their operations. India has emerged as the key alternative.

No More Tears In Trading Onions!
14 Aug, 2023
0
Onions are a staple vegetable with a distinct significance in almost every global cuisine. Also known as a ‘common onion’ or ‘bulb onion’, these underground fleshy bulbs are packed with intense flavor, provide restorative benefits, and aid in creative home hacks. Onion import export data displays that the world just can’t get enough onions!
The onion is famed for bringing tears to anyone’s eyes. This is due to its sulfur-rich volatile oil that oozes on chopping or even peeling the outer covering. And let’s not forget about onions utilised in medicinal and curative capacities to heal various ailments. Mixed in potions and pastes, onions are attributed to bettering colds, and soothing wounds and animal bites.
In cultivation for centuries, onions grow profusely in India, China and Middle Eastern countries due to their temperate weather and rich soil content. Romans worshiped this bulb for its unique shape and internal ring-like structures. At some point, they were also used as currency in trade negotiations.
The Trade Vision is a premier data provider and market intelligence company with decades of import-export experience. Access our data on the go with comprehensive reports from over 100 countries.
Product Overview
Onions are categorized as herbaceous biennial plants in the Amaryllis family. It is seen as a vital ingredient in cuisines all over the world in dishes such as stews, roasts, grills, soups, and salads. What it lacks in nutrition, it makes up with its strong pungent flavour and a hint of sweetness when used precisely. There are roughly 20 odd varieties of onions around the world with unique tastes and features including shallots, green onions and Spanish sweet onions.
Given the ideal climate conditions, ample resources and agricultural land, India was the leading producer of onions around the world at $94.4M. Countries like New Zealand and Mexico were close competitors in this vegetable production at $33.5M and $32.4M respectively. The 2021 export data ranked onions at a whopping $7.53B.
Export Analysis
Unsurprisingly, China reigns as the biggest exporter of this vegetable at $2.58B. This underground bulb can vary in size, shape, color, and pungency depending on the external climate. Countries like Spain, Mexico, and India exhibit a superior habitat needed to grow and store this crop at its best quality. Exports of onions also open up agricultural employment opportunities and boost supply chains.
Top Exporting Countries (2021)
- China ($2.58 billion)
- Netherlands ($914 million)
- Spain ($697 million)
- Mexico ($473 million)
- India ($471 million)
Import Analysis
Countries with unsuitable temperatures to produce onions such as the US rely on importing onions from Asian countries. On the other hand, East Asian countries like Indonesia, Malaysia, and Vietnam import heavily to bring depth and richness to their cooking and culture. Owing to its ability to battle through harsh weather, the bulb is used to its full capacity in various forms.
Top Importing Countries (2021)
- United States ($777M)
- Indonesia ($617M)
- Vietnam ($482M)
- Germany ($450M)
- Malaysia ($332M)
What to Expect
Onions are one of the most versatile vegetables but reflect fluctuating trading patterns. Like any agricultural product, onion trading is impacted by weather fluctuations, economic circumstances and customer trends. Investing in this underground bulb can be a gamble. You can keep track of the trade momentum with us. At the end of the day, onions are a vital food commodity that will remain in demand for centuries to come.

Overview of the Men’s Non-Knit Shirts Industry
8 Aug, 2023
0
Shirts have been around in some form or another for as far back as ancient Egypt (3000 BCE). They allow for the aesthetic of form-fitting trimness while still giving enough room to maneuver. We have gone from shirts being undergarments to having flamboyant embroidery and frills donned exclusively by royalty (Sumptuary Law).
It’s safe to say that this robust article of clothing is beyond popular even today. The latest shirts import export data shows that over $68 billion of revenue was generated worldwide in 2022.
The Trade Vision is a premier data provider and market intelligence company with
decades of experience in import-export statistics. Access our data on the go with
comprehensive reports from over 100 countries.
Product Overview
The clothing industry is segmented into various subcategories. This segmentation is based on the manufacturing process and the target customer base. One broad category is Knit and Non-Knit, then there are clothes for men, women, and children. These are the commercial terms for global brands and exclude local handicrafts, which are loosely documented.
Sweaters, coats, jeans, jackets, suits, and pants all have their own supply chains, standard manufacturing processes, and common materials. This article focuses on the global trade data for Men’s Shirts in the year 2021. These may be made from a variety of materials, including cotton, silk, and polyester, and can be short or long-sleeved.
Export Analysis
All four of the top exporting countries of this commodity are the preferred locations to manufacture ready-made clothes. They all have favorable cultural, political, and social factors that make production and labor comparatively inexpensive for manufacturers. Bangladesh and China have already been leading the production for decades now.
Meanwhile, India and Germany have been leading in craftsmanship and high-quality products, respectively. The men’s non-knit shirts export data suggests that Vietnam is an emerging player in this industry. The Asian country’s trade policies have played a big role in achieving this position.
Top Exporting Countries (2021)
- Bangladesh ($1.72 billion)
- China ($1.71 billion)
- Vietnam ($825 million)
- India ($747 million)
- Germany ($535 million)
Import Analysis
By and large, the main reason these countries import much of their men’s shirts is a matter of economic convenience. Due to the laws and high standards of living, labor-intensive production cycles like clothes can be very expensive. While there are a ton of small-scale craftsmen, large-scale operations cannot exist here without ramping up the prices of the products.
You can see in our free men’s non-knit shirts import data that imports also include textiles, fibers, and other raw materials. Hence, many clothes are imported by these countries to be repurposed for their own industries.
Top Importing Countries (2021)
- United States ($2.37 billion)
- Germany ($877 million)
- Japan ($611 million)
- Spain ($485 million)
- France ($476 million)
What to Expect
Decentralized transportation and the Internet have made direct-to-consumer selling very popular, bypassing traditional retail supply chains. While this is still a small fraction of global trade, these models hold great opportunities for all kinds of traders. Shirts are close to consumer products and have a healthy and strong demand, it’s never too late to get into this business.
It’s important to find companies that are keen on reducing their environmental impact, investing in brand-building, and making quality products. Customization, sustainability, and inclusivity are some hot terms you should look out for.

Bicycles: Wheeling to A Sustainable Future
8 Aug, 2023
0
The modern bicycle was built in the 1800s by John Kemp Starley. Like the ‘Rover Safety Bicycle’, present bicycle models typically have two wheels and are powered by the rider manually. This invention became the starting point for the development of the modern bicycle. The original structure and designs remain unchanged except for the addition of safety and steering elements.
Bicycle import export data indicates that bicycles have grown in favor over the decades. They are used in varied ways including transportation, tourism, exercise, recreation, and sports. Importantly, bicycles helped women achieve a sense of freedom from societal restraints. The great scientist, Albert Einstein, stated that he conceived his General Theory of Relativity while riding a bicycle!
Electric bicycles, with various commercial and personal applications, use robust batteries or electronic charging ports to keep them running. This is comparatively expensive and uses resources that can be beneficial in other areas.
The Trade Vision is a premier data provider and market intelligence company with decades of import-export experience. Access our data on the go with comprehensive reports from over 100 countries.
Product Overview
The Golden Age of Bicycles ranged from the 1900s to the 1950s. Bicycles became the leading source of public road transportation across America and Europe. The two-wheeled ride was created in Paris but was later moved to the USA for further development upon adequate funding. Ironically, today the USA imports the highest number of bicycles globally at $2.15B.
The world registered a decline in bicycle production with the introduction of motorcars and automobiles. But it proved to be beneficial during the World Wars due to limited fuel resources and transportation.
Although bicycles have taken on different forms and aesthetic designs, they are mainly built with aluminum and carbon fiber materials. In 2021, Bicycle exports grew by 28.4% rising from $9.45B to $12.1B globally.
Export Analysis
With large production factories and manpower resources, bicycles are heavily exported from East Asian countries. According to the lates bicycle export data, China holds the biggest share of manufacturing and assembly of bicycles in the world. European countries such as Germany, and the Netherlands are both major importers and exporters.
Top Exporting Countries (2021)
1. China ($5.06 billion)
2. Chinese Taipei ($1.41 billion)
3. Germany ($833 million)
4. Netherlands ($755 million)
5. Cambodia ($616 million)
Import Analysis
Several countries are now looking towards bicycles as an affordable transport system. Japan is known for its bike-friendly infrastructures, bike lanes and parking systems, to encourage cycling as an eco-friendly option. While Europe and America lead import numbers, bicycle import data displays a rising trend in East Asian countries such as Vietnam, the Philippines, and Malaysia. The cities prominently run on bicycle tourism and people use it to commute too due to the dense population and narrow roadways.
Top Importing Countries (2021)
1. United States ($2.15 billion)
2. Germany ($1.05 billion)
3. Netherlands ($828 million)
4. Japan ($706 million)
5. France ($545 million)
What to Expect
There is a critical need to reduce our carbon footprint and promote a cleaner environment. Bicycles are a great vehicle to achieve this. They offer ease of travel in traffic-congested routes, build a healthy lifestyle, and are easy on the wallet compared to cars and motorbikes.
The shift towards modern means of travel has caused a drop in traditional bicycle production. This makes it a cost-effective investment choice. A societal trend reflects in consumers switching to bicycles as a preferred mode of personal and public transport. When all is said and done, investing in a bicycle is as good as supporting a sustainable future.

Are Solar Panels High In Demand?
7 Aug, 2023
0
Human beings have been worshiping the sun for as far back as all of recorded history. Today, we know scientifically that the sun is indeed the engine of our entire solar system. Yet the importance of this heavenly body for our survival might have been instinctually recognized by countless people before us.
The import export data for solar panels should serve as proof of one thing above all else: countless people are willing to spend billions of dollars in order to capitalize on this course of energy.
The Trade Vision is a premier data provider and market intelligence company with
decades of experience in import-export statistics. Access data on the go with
comprehensive reports from over 100 countries.
Product Overview
Solar systems use Photovoltaic (PV) technology to convert sunlight into electricity. The smallest functional PV component (called a cell) is made from semiconductor materials and generates about 1-2 Watts of power. These are about the size of four human hairs. Cells are connected in a row to form modules, also known as panels.
This structure allows solar cells to power all kinds of electricity requirements. Modules are lined up in the form of arrays and connected to the electrical grid to form a full solar system. There are also a few other components, like ones that convert the direct current (DC) generated by cells into alternating current (AC).
Export Analysis
As expected from such technological commodities, China tops the list by a landslide. The country benefits from economies of scale boosted by immense government support in this field. Meanwhile, countries like Japan and Germany have quite a history of pioneering this technology.
Those were some of the more obvious markets on the list, and the remaining two might have some great opportunities. Malaysia has long had a well-established semiconductor industry, while Vietnam is an emerging player due to its inexpensive labor and production costs. We can see in the solar panels export data that all kinds of solar components are exported from Vietnam.
Top Exporting Countries (2021)
- China ($33.1 billion)
- Malaysia ($5.57 billion)
- Japan ($4.51 billion)
- Vietnam ($4.16 billion)
- Germany ($3.12 billion)
Import Analysis
All the top importing countries have strong cultural and political factors that drive the demand for solar energy. The US, China, India, and many European countries have all made ambitious pledges to adopt more renewable energy sources. Their imports in the year 2021 reflect their effort to meet these goals.
The photovoltaic device’s import data also shows that the Netherlands and Hong Kong act as trade hubs for all across Europe, China, and other countries.
Top Importing Countries (2021)
- United States ($9.46 billion)
- Netherlands ($5.82 billion)
- China ($5.57 billion)
- Hong Kong ($5.25 billion)
- India ($4.45 billion)
What to Expect
As the climate crisis continues to affect people worldwide, government bodies are facing more pressure to reduce their carbon footprint. With environmental awareness becoming common sense, people are actively moving toward renewable energy. It’s safe to expect that safe and versatile green energy solutions like photovoltaic devices will continue to see massive growth in demand.
Keep an eye out for emerging technology like thin film solar panels, bifacial modules, and improved energy storage solutions. You should also look out for policy changes, trade agreements, and tariffs to find opportunities in this highly-regulated field. Some emerging markets for photovoltaic devices are: India, Brazil, UAE, Mexico, and Vietnam.

Phosphorus: Fueling Global Development and Agricultural Growth
25 Jul, 2023
0
Phosphorus, a vital element for agriculture and industrial applications, plays a pivotal role in global development and food security. Understanding the import and export trends of phosphorus provides valuable insights into the global market dynamics, supply-demand balance, and emerging opportunities. In this article, we will explore the historical origins of phosphorus, examine the phosphorus trade over the last fifty years, and analyze the current-day phosphorus export and import data.
The Trade Vision is a premier data provider and market intelligence company with decades of experience in import-export statistics. Access our data on the go with comprehensive reports from over 100 countries.
Phosphorus: Origins
Phosphorus, discovered by German alchemist Hennig Brand in 1669, is an essential element for various biological processes. It is a critical component of fertilizers and serves as a fundamental building block for DNA, RNA, and energy transfer in living organisms. Phosphorus is primarily obtained from phosphate rock deposits found in regions such as the United States, Morocco, and China.
Over the past fifty years, phosphorus trade has experienced significant changes. Historically, a few countries with abundant phosphate rock reserves, such as the United States and Morocco, dominated the global phosphorus market. However, with the exploration of new deposits and the emergence of mining operations in other regions, the phosphorus trade has become more diversified. Countries like Vietnam and Kazakhstan have become major players, contributing to the global supply of phosphorus.
Phosphorus Export Analysis
Analyzing the current-day phosphorus export data reveals the key exporting countries and their market share. Vietnam remains one of the largest exporters of phosphorus, owing to its rich phosphate rock reserves. Other significant exporting nations include Poland, Kazakhstan, and the United States. These countries play a crucial role in meeting the global demand for phosphorus-based fertilizers, supporting agricultural productivity worldwide.
Phosphorus: Top Exporters
1. Vietnam ($380 million)
2. Kazakhstan ($135 million)
3. United States ($54 million)
4. Poland ($23.7 million)
5. ($23.5 million)
Phosphorus Import Analysis
Latest phosphorus import data tells us that India is one of the largest importers of phosphorus, driven by its agricultural needs to support a growing population. Brazil and the United States also feature prominently in the import market due to their extensive agricultural sectors. These countries rely on imported phosphorus to enhance crop yields and ensure food security.
Phosphorus: Top Importers
1. India ($166 million)
2. Germany ($109 million)
3. Japan ($92.2 million)
4. Brazil ($44.9 million)
5. Czechia ($44.3 million)
Where the phosphorus marked is headed
Looking ahead, the phosphorus industry faces several future trends and challenges. As the global population continues to grow, the demand for phosphorus-based fertilizers will remain high to support increased agricultural production. However, the availability of high-quality phosphate rock reserves is becoming limited, posing a challenge to the sustainability of the industry.
To address these challenges, the phosphorus industry is focusing on sustainable practices, such as improved phosphate rock mining techniques, recycling and reusing phosphorus, and developing efficient phosphorus management strategies. Additionally, advancements in precision agriculture technologies and digital solutions will optimize phosphorus utilization, reducing waste and environmental impact.

Gym Equipment’s Booming Potential
13 Jul, 2023
0
Fitness and dieting are modern solutions to modern problems. We led an active lifestyle and consumed various foods in the natural environments our bodies evolved in. Today, we have left that life far behind.
The gym equipment import-export data serves as good evidence. The industry is expected to reach $273 billion in revenue by 2030 at its current growth rate. People just aren’t happy without some kind of physical exercise.
With a lack of any inherent physical activity in our new high-tech world, gyms offer an efficient and accessible solution. Let’s look at some standard equipment found in a gym to ascertain its supply chain.
The Trade Vision is a premier data provider and market intelligence company with
decades of experience in import-export statistics. Access our data on the go with
comprehensive reports from over 100 countries.
Product Overview
Out of the various types of gyms, we can narrow down the most common equipment by their utility. Starting with the biggest in size, most gyms would have the following:
- Installed Equipment: Infrastructural pieces like dumbbell racks, bench press benches, and Pull up rods. These are often sourced locally, although they are also traded across borders.
- Heavy Weight Lifting Machines: These include Smith machines, Rowing machines, Leg Press, Cable machines, and Other heavy sets that are sold as one piece.
- Cardio-Specific Heavy Machines: Like Stationary Exercycles, Stairmasters, and Treadmills. These involve some technology and maintenance.
- Portable Weights: Dumbbells, kettlebells, barbells, and other weights. These are often sold in sets or individually. I’ve also considered specialized portable equipment like Battle Ropes here.
- Functional Training Equipment: Everything from yoga mats and skipping ropes to ab rollers and resistance bands.
There are also other specialized types of equipment that are commonly traded, like wrestling mats and floor cushioning. Moving on to the supply chain.
Export Analysis
Each of the leading destinations has its own cluster of specialization. It is more obvious for some than others, like China. The country’s manufacturing capabilities and vast network of suppliers make it ideal for various kinds of these products.
Meanwhile, the Netherlands is a major trade hub for all of Europe with strong logistics and infrastructure. The gym equipment export data also shows that Italy exports some high-end and aesthetic products in this category. Some examples of these brands would be Prodotti and Panatta.
Top Exporting Countries (2021)
- China ($12.2 billion)
- Chinese Taipei ($2.52 billion)
- United States ($769 million)
- Netherlands ($663 million)
- Italy ($542 million)
Import Analysis
The need for gyms is something unique to higher-income class people who sit at desks and work in offices. That’s why we see that the biggest importers are some of the most developed countries in the world. As people’s earnings increase, they focus more on their quality of life.
This makes them more health conscious. With high-paying jobs that take up their time, gyms provide an efficient way to achieve higher levels of health and satisfaction. The gym equipment import data shows that these countries import specialized equipment from all over the world.
Top Importing Countries (2021)
- United States ($6.46 billion)
- Germany ($1.28 billion)
- United Kingdom ($1.01 billion)
- Canada ($881 million)
- Netherlands ($729 billion)
What to Expect
We can see an increasing awareness about health and fitness, coupled with a growing emphasis on personal wellness worldwide. Experts expect explosive growth in the coming years. The industry is currently valued at $621 million and is expected to rise to a whopping $3,472 million, and that’s just in the US!
The rise of smart fitness devices and connected equipment is anticipated to shape the future, providing personalized and interactive fitness experiences. Innovative product design, technological advancements, and a focus on user experience are some of the biggest growth factors.

Aluminum Ore Powering the World
13 Jul, 2023
0
Bauxite, an essential ore for aluminum production, plays a crucial role in various industries worldwide. Understanding the import and export trends of Aluminum ore provides valuable insights into the global market dynamics, supply-demand balance, and emerging opportunities. In this article, we will delve into the Aluminum ore import-export data and conduct a comprehensive analysis to shed light on the current state of the industry.
The Trade Vision is a premier data provider and market intelligence company with decades of experience in import-export statistics. Access our data on the go with comprehensive reports from over 100 countries.
Aluminum ore: An unmissable luster
The discovery of Aluminum ore can be traced back to the 19th century when geologists began identifying vast deposits of the ore across different continents. Aluminum ore was first discovered in France by chemist Henri Sainte-Claire Deville in 1821. However, significant Aluminum ore reserves were found in the Caribbean islands, particularly in Jamaica and Suriname, in the early 20th century. These discoveries led to the establishment of large-scale mining operations and the emergence of the global Aluminum ore trade.
The recent history of Aluminum ore
Over the past five decades, the Aluminum ore industry has experienced notable shifts in trade patterns and market dynamics. In the 1970s, the global Aluminum ore trade was dominated by major producers such as Jamaica, Australia, and Guinea. These countries held significant reserves and supplied Aluminum ore to meet the growing global demand for aluminum.
In the 1980s and 1990s, the landscape of the Aluminum ore market started to evolve. New players, including Brazil, Malaysia, and India, emerged as major exporters, contributing to an increase in global supply. The diversification of Aluminum ore sources led to changes in trade routes and reduced dependence on a few dominant suppliers.
Aluminum ore Export Analysis
In terms of exporting countries, Guinea has emerged as a major player, overtaking Australia and becoming the world's leading Aluminum ore exporter. The country's vast Aluminum ore reserves and the presence of large-scale mining projects have positioned it at the forefront of the global market. High-grade Aluminum ore with low impurities remains in high demand, particularly for the production of aluminum products that require superior quality raw materials.
Top Export Countries
1. Guinea ($3.2 billion)
2. Australia ($991 million)
3. Indonesia ($657 million)
4. China ($211 million)
5. Brazil ($190 million)
Aluminum ore Import Analysis
The early 2000s witnessed a surge in demand from emerging economies, particularly China, as its rapid industrialization drove the need for aluminum. China became a significant player in the Aluminum ore market, both as an importer and an investor in mining projects across the globe.
China remains the largest consumer and importer of Aluminum ore due to its robust aluminum industry. However, other countries, such as India, continue to increase their demand for Aluminum ore to support their growing aluminum production capacities.
Top Import Countries
1. China ($3.94 billion)
2. India ($211 million)
3. United Arab Emirates ($199 million)
4. United States ($197 million)
5. Ukraine ($186 million)
Aluminum Ore: What the future has in store
The future of the Aluminum ore industry looks promising, with increasing demand for aluminum from sectors like automotive and construction. Emerging economies such as China and India will play a significant role as major consumers. Technological advancements and sustainability initiatives will drive innovation in mining and processing methods. By leveraging the insights gained from data analysis, stakeholders can navigate challenges, seize opportunities, and contribute to the growth and development of the global Aluminum ore industry.

Take a Look at the Eyewear Industry
22 Jun, 2023
0
Humans have always suffered from visual impairments, yet these conditions have become more prevalent with time. The humble pair of glasses has made clearer vision more accessible, increasing the overall quality of life. Even the most conservative estimates suggest that one in two people require them today.
The newest spectacles import-export data shows that the industry is currently worth around $170 billion. And a medium-to-low level of growth is expected in the future. The demand and consumption rates are relatively stable while supply is steadily growing.
The Trade Vision is a premier data provider and market intelligence company with decades of import-export experience. Access our data on the go with comprehensive reports from over 100 countries.
Product Overview
The product is considerably rudimentary, with just three basic components: Frame, Lenses, and Hinges or connecting components. Lenses are the only part that tends to range from highly sophisticated and advanced to basic ones, used primarily in fashion.
In fact, specialized lenses comprise the highest price bracket in this market. Custom glasses for color blindness are just one example, besides ones that can protect the eyes from screens.
Sunglasses, safety glasses, concave, convex, bifocals, and eyewear made from any kind of material for all uses are also included in this category.
Export Analysis
The top exporting countries in the eyewear industry have made great strides in pushing the envelope. Each one is renowned for its various strong suits. For instance, the US is home to iconic fashion brands like Ray-Ban and Calvin Klein. The country also leads in frame design and lens technology research and development. Meanwhile, Italy, the birthplace of Balenciaga, is lauded as the capital of high-end fashion.
Conversely, China has a well-established supply chain ideal for eyewear production, just like camera lenses. It’s common to find copies of high-end designs here for a fraction of the price. We also see in the glasses export data that Germany exports a lot of industrial-grade and performance products for sports and safety needs.
Top Exporting Countries (2021)
- China ($3.71 billion)
- Italy ($3.08 billion)
- Chinese Taipei ($576 million)
- United States ($480 million)
- Germany ($436 million)
Import Analysis
America and Europe have by far the biggest markets for high-end eyewear. Most people buy locally-produced and affordable eyewear. Chinese products are bought for the same reason. Except for high-end European stock, these imitations are often indistinguishable from the original products.
Not that China only produces counterfeit products. The glasses import data shows that the US imports many of its eyewear components from the Asian manufacturing hub.
Top importing countries (2021)
- United States ($2.81 billion)
- Germany ($637 million)
- France ($588 million)
- Italy ($577 million)
- Hong Kong ($550 million)
What to Expect
Glasses are more of a fashion accessory than a meddlesome necessity. Many people associate them with style, intelligence, or a number of other qualities.
An array of new technologies and designs in both lenses and frames are spurring demand. With increased screen time worldwide, special lenses with features like anti-fog, UV, and screen protection are gaining popularity. Big fashion brands like Thelios are also making waves in terms of fashion and design.
European producers are likely to propel growth in the future, with the US leading in R&D. Affordable products continue to thrive in China. As manufacturers diversify their supply chain, countries like Vietnam and Bangladesh are primed to be growing markets for production.

A Taste of The Wine Business
12 Jun, 2023
0
Alcohol has a very unique position in society. It’s a drug and an addictive substance, similar to the nicotine in cigarettes. Unlike any other drug, though, it is widely accepted as a luxury for celebration in most places, much like a birthday cake. All this makes it a hot commodity with explosive and consistent demand.
Alcohol is also extremely regulated and involves many restrictions, licenses, and procedures, especially for international trading. According to the wine import-export data, the total trade of wine in 2021 amounted to $41 billion. Hence, the wine trade is difficult to enter but well worth the effort.
The Trade Vision is a premier data provider and market intelligence company with decades of import-export experience. Access our data on the go with comprehensive reports from over 100 countries.
Product Overview
The wine of today is easily one of the oldest alcoholic beverages known to man. It has its roots in 4000 BCE ancient Egypt, and it might be even older. Grapes are widely considered the food of the gods; sweet, juicy, refreshing, and delicious. Without refrigeration, it must have been pretty common for them to spoil!
The drink is typically categorized by region. Being native to the Mediterranean region, wines from here are called Old World Wines. If grown and made in any other place, it's called a New World Wine.

The Mediterranean Region, around the Mediterranean Sea
Export Analysis
Old World countries are renowned for their excellent products due to ideal grape cultivation conditions. The varieties found in regions like France and Italy are also perfect for wine production, and quality control is stringent. Meanwhile, Spain is popular for its unique wines made with novel techniques.
The wine export data shows that New World countries like New Zealand and Australia are popular in the Asian market. Wines are made in tropical locations worldwide nowadays, but Old World wines are still at the top. Yet even South African and Latin American wines have unique characteristics with their own markets.
Top Exporting Countries (2021)
- France ($13.2 billion)
- Italy ($8.53 billion)
- Spain ($3.53 billion)
- New Zealand ($2.07 billion)
- Chile ($1.98 billion)
Import Analysis
Wine is closely associated with fine dining, cuisine, and culture. That’s why some of the most developed countries import from the Old World despite having their own production. A great vintage Bordeaux that pairs well with red meat is considered the ultimate of all luxuries.
Our free wine import data shows that countries like the US and the UK import wines from France, Turkey, Italy, etc. Other than that, Australia is a popular origin of great New World wines.
Top importing countries (2021)
- United States ($7.05 billion)
- United Kingdom ($5.09 billion)
- Germany ($3.38 billion)
- Canada ($2.25 billion)
- Japan ($1.68 billion)
What to Expect
This fermented beverage is all about the past and living to the fullest in the present. People are more online now than ever, and international food culture is gaining popularity across the board. Until recently, an occasional glass of wine was considered great for your health. That has now been scientifically disproven within the last few years.
Yet the public’s perception is far from catching up. Wine is considered just like fine food; the two are often seen as symbols of luxury. While the health angle will become more of a challenge in the future, this scarlet ambrosia is far from being forgotten.

Amplifying The Loudspeaker Industry
12 Jun, 2023
0
Loudspeakers are often seen as an annoyance. Ironically, noise pollution has been called a silent epidemic. Yet speakers give us an almost magical ability to amplify our voices. In fact, they allow great feats of mass organization every day worldwide.
The speakers import-export data shows that the industry is valued at around $11 billion. It might be smaller than some of the other electronic industries, but there is great potential for growth. Let’s take a closer look.
The Trade Vision is a premier data provider and market intelligence company with decades of import-export experience. Access our data on the go with comprehensive reports from over 100 countries.
Product Overview
All speakers have a voice coil that converts electricity into sound and directs it to a diaphragm. A diaphragm is a typical circular component that’s often visible, made of rubber, metal, or plastic. It vibrates and sends the audio into the air.
A single speaker cannot recreate natural audio perfectly, multiple ones are used to capture different frequencies. For example woofers for bass, tweeters for tremble, and sub-woofers for other extremities.
Commercially speaking, the product is categorized based on size, quality, and purpose. So we have portable Bluetooth speakers that are often bought on a whim at the bottom. At the top, we have heavy-duty, extremely expensive ones with intricate setups that are used in concerts. These are commonly rented and used for decades.
Export Analysis
Most of the biggest loudspeaker producers are from the US and Japan. There are countless smaller players, but Bose, JBL, Pioneer, and Sony are from these countries. Yet they still lack affordable skilled labor and a developed supply chain within borders. China is renowned for these qualities and also has the biggest consumer market for the product.
Meanwhile, Mexico and Vietnam are preferred for American and Japanese producers respectively for geographical reasons as well. The speakers export data tells us that Hungary has its own production for automotive sound systems. The European country also hosts a portion of Samsung’s production.
Top Exporting Countries (2021)
- China ($2.91 billion),
- Vietnam ($990 million)
- Mexico ($382 million)
- United States ($256 million)
- Hungary ($165 million)
Import Analysis
The individualistic culture in developed countries like the US and Japan is very focused on entertainment. Hence home theater systems, speakers, and concerts are understandably popular. We see in the speakers import data that Germany imports a lot of sound systems for its premium automotive industry.
Top importing countries (2021)
- United States ($1.07 billion)
- Hong Kong ($502 million)
- Japan ($417 million)
- China ($398 million)
- Germany ($324 million)
What to Expect
As countries all around the world develop and globalization spreads popular culture across borders, it’s hard to imagine loudspeaker demand reducing. Experts suggest that the industry will more than double in value to $23 billion as early as 2030. The development of new technology is one of the biggest factors that affect this industry.
Soundbars are currently popular for affordable home audio solutions and more powerful compact batteries are under development. There is a massive demand for high-quality portable audio, but an increasing number of people are actually turning to headphones for personal entertainment.
Be sure to study your target market closely before jumping into the trade of this seemingly evergreen commodity.

Iron: Red-Hot or Rusty?
29 May, 2023
0
Iron is the most high-demand metal on the planet. It’s used in everything from construction to making magnets and beyond. Today, 90% of all refined metal is Iron, which is steel’s principal raw material. It’s the second most naturally abundant metal after Aluminium.
According to the latest iron ore import-export data, the global iron industry is worth $25 billion and is projected to reach $35 billion by 2028. Here's a closer look at its top players, emerging markets, and prospects.
The Trade Vision is a premier data provider and market intelligence company with decades of import-export experience. Access our data on the go with comprehensive reports from over 100 countries.
Product Overview
Humans discovered iron in the copper age (3,000 BCE), and it became so prevalent that it was bought in the Iron Age (1,200 BCE). The invention of efficient furnaces was the next most significant milestone in Iron’s history. The metal has a melting point of over 1300 degrees Celsius, so rudimentary furnaces were insufficient.
Today we can extract it from various sources like Hematite and Magnetite. We can even control the amount of carbon that’s added during the extraction process. Three to four percent carbon makes cast iron that’s brittle, and less than point-five percent makes it malleable like steel.
Export Analysis
Iron is one of the most traded commodities in the world, despite being relatively common. Almost all the countries in the world have their own steel mills. Exporters like Australia and Canada have vast mineral reserves and thriving mining industries, putting them at the top. These two countries lead in Copper exports as well.
According to the iron export data, even countries like Mexico, Vietnam, and Indonesia export this crucial metal. That’s because it is very high in demand, and these countries produce significantly more than they require.
Top Exporting Countries (2021)
- Australia ($118 billion)
- Brazil ($46.2 billion)
- Canada ($8.31 billion)
- South Africa ($7.68 billion)
- Ukraine ($6.83 billion)
Import Analysis
There are different reasons why each of these top players is leading in imports. All of them have thriving manufacturing industries and inadequate supply within borders. Just like Rice, China is the exception, being the biggest producer, importer, and consumer of this commodity.
Japan and South Korea invested heavily in the steel industries after the war, making everything from vehicles to appliances. Meanwhile, the Netherlands is a trade hub for all of Europe. According to the iron import data, most of China’s ore is used in construction.
Top importing countries (2021)
- China ($146 billion)
- Japan ($15.1 billion)
- South Korea ($10.6 billion)
- Chinese Taipei ($4.07 billion)
- Netherlands ($3.91 billion)
What to Expect
While in Q1 of 2023, things looked promising for the Iron trade, the situation is pretty bad right now. As stringent Covid restrictions started easing at the beginning of this year, producers doubled down, expecting high demand. This led to massive overproduction in multiple industries. Things look even bleaker now, as the property market is stuffed.
Even vehicle sales are slumping, and investors have slowed down. As the rainy season approaches, construction will more or less come to a halt. All this to say that (ironically enough) a time in the future might be appropriate for an investment in iron.

A Close Look at Lenses
23 May, 2023
0
Camera lenses give our machines eyes to see the world with. This in turn enhances a human being’s capability to reproduce images and videos. By using our phones and the internet, we can also be viewed by others in the world. Few inventions have been so impactful to our culture.
The best smartphone camera cannot compare to an entry-level DSLR. Their lenses are a big part of the difference. Prevalent lenses import export data suggests that the industry is worth $4.5 million and will grow to about $6.9 million by 2028.
What is it about lenses that make them half as valuable as the entire camera? Read on to find out the top players, emerging hot spots, and what to look out for in the future.
The Trade Vision is a premier data provider and market intelligence company with decades of import-export experience. Access our data on the go with comprehensive reports from over 100 countries.
Product Overview
From the first camera in 1600 and the single lens, to instant digital photos, we have come a long way. All kinds of different lenses are made in exact, meticulous, and elaborate ways, similar to watches.
They also range from casual to professional and specialized in the level. Phone cameras are accessible and enhanced by advanced imagining software. Professional cameras are far superior and give an artistic flair. Dedicated lenses like zoom, macro, telephoto, and wide-angle are also widely used.
Meanwhile security, medical, and research will require products that are more specialized. Each lens has certain characteristics like aperture, focal length, and compatibility.
Export analysis
Manufacturing lenses is a very specialized process that is both labor and machine intensive. This means that companies not only have to hire and manage skilled labor, but also invest massive capital. So lenses tend to be very expensive.
Even then, German lenses like Leica and Japanese lenses like Canon, Nikon, Sony, and Tamron are of the best quality. Many major companies get their affordable lenses mass produced in China. You can see in our free camera lens export data that China also exports a ton of lenses for smartphone cameras.
Top exporting countries (2020)
- China ($3.14 billion)
- Chinese Taipei ($2.31 billion)
- Japan ($2.16 billion)
- Germany ($1.67 billion)
- United States ($685M)
Import analysis
Cameras are a product that people in the middle class really desire as they grow richer. China produces a large volume of rudimentary to advanced camera lenses for various needs and specifications.
The country also has a huge population that imports high-quality lenses for professional photography. The camera lenses import data can also show you the many different uses of lenses.
From medical and scientific reasons to card readers and more. That’s why global commercial hubs like the US, Netherlands, and South Korea import various kinds of specialized lenses.
Top importing countries (2020)
- China ($2.03 billion)
- Hong Kong ($1.78 billion)
- United States ($1.65 billion)
- Netherlands ($1.25 billion)
- South Korea ($1.14 billion)
What to expect
China has a very well established supply chain to make lenses, which makes them affordable. Just like in the case of the mobile phone industry, Covid has put a real strain on that infrastructure. Many lens companies, including Canon and Sony, are looking to diversity their production away from China.
This is the biggest trend in the lens industry. Developing countries like Thailand, Vietnam, and even Indonesia are becoming noteworthy players in the market. Be sure to keep an eye out for opportunities.
In terms of technology, mirrorless cameras and liquid lenses are hot topics. The use of AI-powered software also is very promising for image generation and smartphone photography.

Will PET Bottles Sink or Float?
9 May, 2023
0
Polymers, or plastics are all pervasive in today’s world. It is hard to imagine looking around a modern-day room without finding something made of it. Plastic bottles are used to store consumable items like energy drinks, sodas, and the quintessential drink of water to oil, cleaning agents, detergent, and the like.
Being single-use products, the packaging commodity is inseparable from the question of pollution. The PET industry that produces these bottles is exploding with the growth of developing countries around the world.
We can see in our free plastic bottles import export data; Countries like Vietnam and Mexico are trading plastic bottles worldwide, and with the US.
The Trade Vision is a premier data provider and market intelligence company with decades of import-export experience. Access data on the go with our comprehensive data reports from over 100 countries.
Product Overview
Polyethylene terephthalate (PET), trademarked as Dacron, is a type of plastic ideal for making bottles. It was introduced by a US-based company called Invista in 1954. Since then, it’s become the most popular synthetic fiber in the world.
Technically a fiber and a resin, it can be spun out into thin fibers or molded under heat and pressure. It’s used to make plastic flasks that can be shaped into various kinds of bottles that can hold their shape once cooled.
These flasks are made in bulk and are used by many different people. Big cold drink corporations buy wholesale PET flasks, mold them, fill them up, and use them to sell their products. After use, these bottles are meant to be recycled.
Export analysis
The USA has been the most influential place for this commodity. It’s the birthplace of PET and home to Coca Cola, one of the most influential companies for plastic bottles. Both the leading exporters’ PET production is supplied to the US.
Germany was the first foreign country where Coke expanded its production in the 1990s. After which, Germany became a PET hub and today, it’s well known for its excellent recycling practices.
China, on the other hand, is notorious for its plastic waste levels. The Asian country even banned plastic imports recently. The plastic bottle export data shows that even France is exporting mainly to America.
Top exporting countries (2020)
- China ($2 billion)
- Germany ($948 million)
- United States ($747 million)
- France ($488 million)
- Netherlands ($411 million)
Import analysis
Unsurprisingly, the US is the biggest importer of plastic bottles. As we can see in the plastic bottles import data, most of these imports are from China. So after the flasks are made in bulk, they are bought by factories all over the world. But that’s not all, even used bottles have a worthwhile economic value, as we’ll see in the next section.
Top importing countries (2020)
- United States ($1.58 billion)
- Germany ($765 million)
- France ($724 million)
- Canada ($520 million)
- Netherlands ($437 million)
What to expect
PET is by far the easiest type of plastic to recycle. Its recycling code number is 1 and it has many uses even after being thrown away. It can easily be washed, melted down, and reused to make more bottles. It can also be used to make fibers which can be used in various other things.
Despite all that, less than 20% of plastic bottles are recycled in the US. Exporting plastic waste is becoming unfeasible although it is still very common. Things are in a flux currently as China has banned its plastic waste imports.
Bio-degradable bottles and more efficient ways of recycling will be important factors in the future.

Textiles are resurgent. The environment poses a problem
9 May, 2023
0
In human history, not very long ago, clothes were treated as items that cover a person's body and protect it from ill climate conditions. That if it was fashionable and pleasant in appearance could prove an added benefit. This phenomenon is long a thing of the past. With fast fashion, trends have come and resulted in an all-time high in the production and consumption of clothing. And indeed, clothes now must always be fashionable before they are anything else. This uptrend is confirmed by the latest textile import export data.
For a comprehensive report on textile trade flows, contact The Trade Vision, a premier data provider and market intelligence company with decades of import-export experience. Access data on the go with our expansive data reports from over 100 countries.
Textile Commodity Analysis
Textiles as a commodity include items such as non-knit/knit articles of clothing, t-shirts, rubberized knitted fabric, synthetic woven fabric, yarns, linens, and raw cotton. The textile markets have resurfaced from the worst of the Covid-19 pandemic. The demand has shifted away from PPE kits to apparel-related textile exports. India and Pakistan have capitalised on an increase in demand for knit fabrics.
Textiles Export Analysis
Textiles export data displays that China, the European Union, and India have continued their dominance in the textile market. The top two account for over three-fifths of the global export volume. India, Turkey, and Pakistan have recorded the highest amount of growth in the past few years. Middle and lower-income countries, like Bangladesh and Vietnam, are harnessing the power of low input costs to eat away at developed countries’ market share in the textile sector. This shift will be solidified further in the coming years.
Textiles Top Exporters
1. China ($286 billion)
2. Bangladesh ($46.2 billion)
3. Vietnam ($43.7 billion)
4. India ($41.4 billion)
5. Germany ($40.4 billion)
Textiles Import Analysis
Countries in the developed world import the majority of textiles to make merchandise and other indigenous items of clothing. The United States and countries in the European Union are leaders in textile imports, as per textile import data. Bangladesh, Poland, Vietnam, and China recorded the highest increase in demand. As North American countries look to bring production closer to shore, Latin American manufacturers could see increased production.
Textiles Top Importers
1. United States ($135 billion)
2. Germany ($66.7 billion)
3. Japan ($33.7 billion)
4. France ($33 billion)
5. United Kingdom ($31.3 billion)
What the future holds
Southeast Asian Countries like Thailand, Vietnam, Malaysia, Indonesia, and Hong Kong continue to post heavy gains in building export robustness. Shifting away from emergency production, the world is coming back to producing more apparel and merchandise. Textile global trade is expected to stabilize soon.
The textile industry must focus on meeting sustainability standards and minimizing its impact on the climate. With the advent of fast fashion, new clothing lines are produced and consumed in record time and almost always end up in a landfill. The textile industry is one of the top contributors to climate change. Manufacturers’ response to the challenges and policy interventions aiming to regulate the same will be a key determinant in textiles’ future.

Frozen Fish: A luxury staple
4 May, 2023
0
While classified as luxury items, fish fillets are rich in protein and nutrients, and an essential for the health-oriented. Unfortunately, commercially farmed fish have been displaying alarming levels of toxic contamination in recent years. All our waste and pollution ends up in the ocean. Marine life, sensitive to its environment, is affected both in quantity and quality.
Despite this disturbing news, fish might yet play a crucial role in building a more sustainable future. In the seafood import export data, we see that various types of products are included in this category. Let’s examine these and take a closer look at the global market.
The Trade Vision is a premier data provider and market intelligence company with decades of import-export experience. Access data on the go with our comprehensive data reports from over 100 countries.
Product Overview
A fillet is a boneless cut of meat. Removing the meat from the bones and the rest of the carcass makes it ideal for refined food preparations. For staple fish consumption, very common in Asian countries, the entire fish is cooked and nothing is wasted.
Other than fish, this category of products also includes Crustaceans like prawns, lobster, and other shellfish. Even mollusks like snails and fish eggs, or roe, are included here. These can either be fresh or frozen. The culinary world is massive and there are various seafood delicacies that are highly sought after.
Export analysis
Unsurprisingly, each of the top exporting countries has a massive coastal area, although it isn’t the only reason that they are leaders. Countries like Chile and Vietnam have developing economies with vast aquaculture sectors. Fishing is a common livelihood for their people. Meanwhile, countries like the US and China import a lot of fish, only for processing and re-export. Our detailed fish export data also tells us that Norway is well-known for its premium smoked salmon.
Top exporting countries (2020)
- China ($3.19 billion)
- Chile ($3.13 billion)
- Norway ($2.8 billion)
- Vietnam ($2.5 billion)
- United States ($1.46 billion)
Import analysis
The fish fillet import data has shown how robust the demand for seafood can be. Prices were skyrocketing in Europe in 2022 amid Covid-19 and the Russian war, yet demand remained unaffected. Seafood is a solid part of the cuisine in countries like Japan, Germany, and France. Health-related demand for high-quality protein is also a factor for imports.
Top importing countries (2020)
- United States ($6.44 billion)
- Japan ($2.73 billion)
- Germany ($1.87 billion)
- France ($1.81 billion)
- Netherlands ($1.13 billion)
What to expect
Over the past two years, China has massively scaled down its fishing industry. For the first time ever, fish fillets are at a trade deficit. Meanwhile, the demand for high-quality fish has only grown in the country. This has created room for other international players to enter the picture.
Most commercial fishing operations today use harmful practices that might cause the marine ecosystem to collapse. Just like in the case of air conditioners, global organisations are pressuring businesses to follow better practices.
Compared to other sources of protein, fishing can potentially be done very sustainably on a smaller scale. There are also major developments in the field of artificial proteins, which is a growing industry.

The heat is on for air conditioners
26 Apr, 2023
0
Modern problems require modern solutions. Air conditioners are both a problem and a solution. They allow us to control the temperature and humidity of our sterile indoor environments. Unfortunately, hydrofluorocarbons (HCFs), the most common type of coolants used in ACs, also end up increasing global temperatures.
The air conditioner import export data shows that hundreds of billions of dollars worth of air conditioners are being traded every year. As perception toward ACs changes from a luxury to a utility item, the market continues to grow.
The Trade Vision is a premier data provider and market intelligence company with decades of import-export experience. Access data on the go with our comprehensive data reports from over 100 countries.
Product Overview
Air conditioners have a few common components: evaporators, condensers, compressors, and coolants. Coolants are heat-absorbing liquids that run through the AC systems in thin copper pipes. Indoor units circulate the room’s air over the pipes, and the coolant absorbs the air’s heat & evaporates. This way the room’s air becomes cold.
A condenser unit and a compressor pressurize the gas to liquid and release the heat outdoors. Thereby increasing outside temperatures. We have come a long way from putting wet grass on our windows to cool the incoming winds.
Export analysis
Most of the leading AC technology comes from a few countries; Japan, China, South Korea, and the US. Meanwhile, the biggest demand for ACs is from China, India, and the US. One major factor that exports depend on is the availability of affordable skilled labor. It is unsurprising then, that China, Mexico, and Thailand are leading the list.
Just like its computers, America gets a lot of its heating, ventilation, and air conditioning (HVAC) tech made in Mexico. The air conditioner export data also shows a lot of entries for Vietnam, which is becoming Thailand’s biggest competitor.
Top exporting countries (2020)
- China ($21.4 billion)
- Thailand ($7.14 billion)
- Mexico ($5.06 billion)
- United States ($2.46 billion)
- Germany ($2 billion)
Import analysis
Whether it’s a sofa or an AC, the USA’s demand for affordable consumer goods is abundant. The air conditioner import data also shows that Americans import from China. The three European countries leading in imports are surprising, considering their prevalent anti-AC culture.
For instance, office buildings in France don’t have places for ACs and require tedious approval procedures for installation. The people here import portable indoor solutions to find relief from the heat.
Top importing countries (2020)
- United States ($11.3 billion)
- Japan ($2.93 billion)
- Germany ($2.79 billion)
- France ($2.37 billion)
- Italy ($2.18 billion)
What to expect
The picture has definitely changed since 2020 as many European countries have doubled down on decarbonization. As temperatures increase and weather patterns fluctuate, ACs are more needed than ever. A massive demand is arising in developing countries especially. Just look at the fastest-growing markets for both sales and production: Indonesia, Vietnam, China, India, and Thailand.
For developed countries, this is cause for alarm. Italy, France, Greece, and Spain have already adopted various policies to address these issues. More sustainable air conditioning methods will be a crucial part of the market’s future. Since sales are higher than ever in developing countries, but the climate crisis is at our throats, more efficient technology is a vital part of the solution.

Crude Oil Import Export Data and Analysis
6 Apr, 2023
0
A world without crude oil would be no world at all. This highly valuable commodity runs factories, powers cities with electricity, and makes cars, buses, and other modes of transport. Crude oil affects and is affected by the geopolitical maneuverings of countries that buy or sell a lot of oil. Crude oil import export data tells us how oil-producing countries control prices by adjusting supply.
In recent weeks, crude oil prices surged as several producers announced production cuts. The Russia-Ukraine war has had a great impact on crude oil prices. Over the past year, shortages propelled by sanctions and supply chain blockages have been the subject of much debate.
The development of the world since the industrial revolution has been made possible by the discovery of enormous oil reserves in various parts of the world. The countries that have had easy access to oil reserves and the means to exploit it have generally fared well on the scale of development. Learn more at The Trade Vision.
Crude Oil: Commodity Overview
Ancient records have verified that crude oil has been used as a fuel source in one form or another for several millennia. Today, oil powers everything we know. The commodity’s price is measured by the benchmarks of Brent Crude (for Africa, Europe, and the Middle East) and WTI Crude (for North America).
Crude oil is a fossil fuel and one of the primary contributors to climate change. Not only the combustion, but the production too is energy intensive and emits significant qualities of greenhouse gases. Oil spills and leaks also affect biodiversities and lead to the destruction of marine life.
Crude Oil Export Analysis
Middle-eastern countries have dominated oil production in recent years and have seen significant economic growth as a result. Besides, Russia is also one of the top exporters of crude oil. Although the supply has been severely impacted due to the war in Ukraine. The reduced supply has adversely affected energy prices in Europe. Other export areas include Africa and South America. Crude petroleum is the world’s top-traded commodity. The cumulative trade volume stood at $951 billion in 2021, almost a 50% jump from a year before.
Crude Oil: Top Exporters
1. Saudi Arabia ($138 billion)
2. Russia ($113 billion)
3. Canada ($81.2 billion)
4. Iraq ($72 billion)
5. United States ($67.6 billion)
Crude Oil Import Analysis
Developing countries in Southeast Asia and South America are showing an increased appetite for crude oil. But the leaders of development, China and the United States dominate the charts when it comes to the import bill’s size. Although several countries have made ardent climate commitments, few actually focus on building systems that can be useful in the long term and reduce dependence on imported crude oil.
Crude Oil: Top Importers
1. China ($208 billion)
2. United States ($120 billion)
3. India ($93.5 billion)
4. South Korea ($60.6 billion)
5. Japan ($54.9 billion)
Reducing Dependence on Fossil Fuels
The Intergovernmental Panel on Climate Change (IPCC) Special Report notes that reduction in the use of fossil fuels is key to keeping climate change under control. The nations that produce oil must chart a way to economic growth that doesn’t depend on fossil fuels. While purchasing countries must invest in renewable energy sources that are much less carbon-intensive.

Lazy Boy or Victorian: Which one’s for you?
3 Apr, 2023
0
The Sofa is a place for us to sit together with our visitors and loved ones. Many of our relationships are maintained through this unassuming piece of furniture. With modern times, comes a sense of individualism. Couches are hence becoming the symbol of ultimate comfort and relaxation for hard-working individuals.
The living room, a sacred respite from the pangs of modern life, is incomplete without it. The sofa import export data displays the popularity of sofas in some of the biggest populations of the world. Read on to find out more about the sofa market, and how you can best leverage its opportunities.
The Trade Vision is a premier data provider and market intelligence company with decades of import-export experience. Access data on the go with our comprehensive data reports from over 100 countries.
Product Overview
The word “Sofa” comes from the Turkish “Suffah” meaning “ledge/bench”, although it referred to what we call a Divan. It originated in the Persian (/Ottoman) empire, renowned for its detailed and luxurious interiors. The true sofa was born in the Victorian era (the 1800s) as finely crafted furniture for the wealthy. From there, it eventually found its way to the masses. The intricate woodwork and upholstery turned to the single-seat Lazy-boy. Thus, couches became significantly affordable, like the ones in IKEA, and very comfortable, like the aforementioned Lazy boy.
Export analysis
Our free sofa export data shows China exporting typical leather sofas. While the country has its own coveted oriental style of furniture, many MNCs get their value-for-money couches built here. Meanwhile, Poland manages to top the list by strategically attracting the world-famous Swedish company IKEA to build within its borders. Importers should keep in mind that Vietnam’s potential is growing as a furniture manufacturer. While Turkey and Romania continue to capitalize on the legacy of the Persian empire. Hence, luxury sofas imported from here will have an added degree of legitimacy.
Top exporting countries (2020)
- Poland ($578 million)
- China ($548 million)
- Turkey ($136 million)
- Romania ($112 million)
- Vietnam ($72.3 million)
Import analysis
We see in the sofa import data that the US, UK, and Japan import a majority of their sofas from China. As mentioned before, the US imports its products that are made in China to be sold by American companies. These top importing countries also have increasingly individualistic cultures that make them the ideal market for this commodity.
Top importing countries (2020)
- United States ($285 million)
- Germany ($269 million)
- France ($227 million)
- United Kingdom ($87.4 million)
- Japan ($68.5 million)
Market Overview
Ultimately, the story of the sofa is about mankind’s dedication to achieving the ultimate quality of life. With the spread of modernity also comes the prevalent economic system of capitalism. Whether it’s a medium-class teenager in America or a middle-high-class family man in India, everyone wants their own fully furnished home.
IKEA stores are opening all over the world as brand awareness and demand for their products grow. The masses need more affordable consumer goods to represent their identities.
While this is true, higher-income demographics also need finer products to set themselves apart from the IKEA-goer. Developed nations like the UK will likely have scope for more intricate and stylized couches. Also, consider couches with high-tech features for these demographics. Additionally, the products must be eco-friendly to appeal to conscious customers.

Computers: Free Import-Export data and market overview
3 Apr, 2023
0
Computers are a great signifier of human achievement’s defining characteristics. That being said, it could never have been made by a lone individual. Older generations might look at a computer with some hostility, having witnessed them seemingly take over every aspect of our existence within their lifetime.
And taken over, they have. Our smartphones, laptops, PCs, servers, and supercomputers are all computers. We will focus on the market of laptops, personal computers, their different parts, and components in this article. The computer import export data, suggests that the personal computer market is worth hundreds of billions of dollars.
Read till the end to find the biggest opportunities for your business.
The Trade Vision is a premier data provider and market intelligence company with decades of import-export experience. Access data on the go with our comprehensive data reports from over 100 countries.
History
Computers have a very long and detailed history that started in an unexpected place, the abacus. Essentially, computers are data processing units, and the abacus was just that. It allowed people to calculate things that they could never before just using their heads or pen & paper.
The very first computers were made to be calculators. Slowly but surely, we introduced the binary system of ones and zeros to do “computing”. The modern-day home computer is the descendent of the Macintosh by Apple. This descendant is what we focus on in this article.
Export analysis
About 80% of all the major computer companies are originating in the US. It’s by far the single biggest technological hub of the modern-day world. Looking at the computer export data we can see names like HP, Nvidia, and Intel. Most of these American companies set up factories in places with cheap unskilled labor to cut costs.
The biggest of which are China and Mexico. China has used this to its advantage, however. They have strategically imported America’s cutting-edge technology over the past 30 years. Today, China has its fair share of companies and enjoys the biggest market share for production.
Top exporting countries (2020)
- China ($156 billion)
- Mexico ($31.5 billion)
- United States ($16.6 billion)
- Netherlands ($13.7 billion)
- Germany ($12.2 billion)
Import analysis
Take a look at the USA’s computer import data. Components being built across the world are imported to be assembled by people for their personal use. Whether it's for video games, YouTube, marketing, education, or business, the first world needs a ton of computers. These are all growing industries but are already mainstream in the countries listed below.
Top importing countries (2020)
- United States ($92.4 billion)
- Germany ($22.2 billion)
- Hong Kong ($16.9 billion)
- Netherlands ($14.7 billion)
- Japan ($14.5 billion)
What to expect
The computer industry is exponentially growing every day with no signs of slowing down anytime soon. Whether it's in the private or professional realm, we are increasingly becoming dependent on computers for all our needs. Considering how massive the industry already is, traders need to keep up to date on all the latest information.
Importers and exporters need to understand the global as well as their local markets to find opportunities in personal computing. Currently, the vast majority of industry leaders like Apple and Microsoft are based in America. While some Asian countries are also starting to develop their production. Like Samsung in South Korea, and Lenovo in China.
Developing countries around the world have started to compete with these global powerhouses.

Lighters and Their Unacknowledged Brilliance
28 Mar, 2023
0
The household lighter is a colossal achievement of human ingenuity. Discovering fire sent us ahead by lightyears in the fight for survival. With time we learned to harness it so well, that we now take it for granted. The ability to conjure a flame with a simple snap of the fingers.
Lighters come in all shapes and sizes with different market segments and consumer groups. All lighters have three common elements: Fuel for burning, ignition to light, and control over both. The lighter import export data clearly shows that smoking is the biggest driver of the market. Which would come as a surprise to no one. Read on to find out why France is both a leading exporter and importer of the commodity.
The Trade Vision is a premier data provider and market intelligence company with decades of import-export experience. Access data on the go with our comprehensive data reports from over 100 countries.
A history of enlightenment
The earliest lighters were like small fire kits with tinder, wick, or naphthaline as fuel and sulfur or flint as ignition. The containers were made with metal, resinous wood, or ceramic and could be used to put out the fire. Here are some major milestones worth noting: Shifting from flint to ferrocerium (by Carl Auer von Welsbach in 1903); Shifting from Naphthaline to liquified butane gas (by Zippo in the 1950s); And the introduction of piezoelectric ignitors that made this commodity cheaper than ever.
Export analysis
China is an all-rounder in the lighter market. The lighter export data shows that the country produces about 70% of all lighters in 2010. Cheap disposable lighters, medium-range electronic lighters, and even the parts for high-end lighters are made here. The other countries have major manufacturers of the commodity within their borders. France is home to both the luxury brand S.T. Dupont and the everyday Bic. The US hosts the iconic Zippo and also produces a wide range of novelty, high-quality, and multipurpose lighters. Similarly, Clipper does much of their production in Spain.
Top exporting countries (2020)
- China ($787 million)
- France ($257 million)
- United States ($119 million)
- Spain ($104 million)
- Germany ($66 million)
Import analysis
According to the lighter import data, lighter components being imported by manufacturers are also included in this category. The US, Germany, and France import components for novelty and designer lighters catering to their highly segmented lighter markets. These countries were also one of the first ones to adopt a culture of smoking tobacco. As such, a larger percentage of the population needs cheap disposable lighters as well. Alternatively, Indonesia and Japan have a high demand for consumer goods and depend on imports for this commodity.
Top importing countries (2020)
- United States ($272 million)
- Germany ($105 million)
- France ($64.4 million)
- Indonesia ($58.9 million)
- Japan ($58 million)
What to expect
The market for lighters is expected to grow gradually at an underwhelming 1.02% rate per year. As the population keeps increasing and tobacco dependency culture spreads with it, the market for lighters is evergreen and stable. While plastics become increasingly frowned upon, the incessant demand for portable and controllable fire will prevail. The market might seem saturated but luxury products have scope in high-income markets. Novelty products like pistol-shaped lighters have scope in commercial markets and inexpensive products have scope in developing markets.

Marbleous Prospects for the Future
13 Mar, 2023
0
Marble is a metamorphic rock found in the older layers of the Earth’s crust. It's formed by limestone or dolomite under great heat and pressure. It's smooth, glossy, elegant, and luxurious. Translucent and crystalline, sunlight penetrates it from 0.5 to 1.5 inches. Pure marble is white but different minerals can react with it to create countless colors and shades during its formation.
The marble import export data suggests a long tradition, a strong demand, and a huge scope for the future. But first, let’s take a deeper look.
The Trade Vision is a premier data provider and market intelligence company with decades of import-export experience. Access data on the go with our comprehensive data reports from over 100 countries.
A closer look
Marble is fairly abundant but difficult to mine. It has to be carefully chiseled into liftable blocks right out of the mine. The first known excavation was in Italy, Tuscany in 150 BCE. This was a herculean task back then, done manually with hammers, pulleys, and logs. Hence it was used in palaces and buildings concerning larger groups of people. The Aegean sea’s marble-rich islands and the Anatolia peninsula became excavation hubs of the ancient world. It has become increasingly popular since.
Stonemasons used to refer to any rock that was aesthetic, rich in calcium, and polishable as marble. This included the comparatively inexpensive Travertine stone, the elegant Alabaster, and even some non-metamorphic forms of limestone. Industrialization allowed us to optimize the process and make the stone more accessible than ever. Despite modern solutions, roughly half of the marble produced is wasted during mining.
Export analysis
The Aegean sea and the Anatolian peninsula mentioned above coincide with modern-day Greece and Turkey respectively. As we can see in the marble export data, commercial hubs from over 2000 years still thrive today. The Italian Cassara marble from Tuscany is a world-renowned art material. It was used by the great Michelangelo and is still highly sought after. These regions have many high-end varieties of marble at expensive prices.
Top exporting countries (2020)
- Turkey ($679 million)
- Italy ($289 million)
- Greece ($187 million)
- Iran ($87.9 million)
- Portugal ($71.6 million)
Import analysis
Its extensive use in temples, churches, statues, and other coveted structures has given marble an elite association in the minds of most people. Rapid urbanization in developing countries has been the biggest driver of market growth and demand. Thus despite being one of the biggest producers of marble, India, and China are still the leading importers of the stone. In the marble import data, we can see many other developing countries like Indonesia also have significant imports.
Top importing countries (2020)
- China ($1.15 billion)
- India ($129 million)
- Italy ($62.9 million)
- Egypt ($43.4 million)
- Chinese Taipei ($25.3 million)
What to expect
As marble becomes more easily available and retains its coveted status, demand is expected to increase. Increasing global urbanization also offers new opportunities in developing markets. Turkey and Syria were hit with a 7.2 magnitude earthquake on 10th March 2023. Price fluctuation and disruption in supply can be expected here.
The overall market is highly segmented with a wide range of prices based on factors like polish and composition. Finding the right niche for sellers and the right segment for producers is key to success.

Cobalt: Blue, Green and Red
13 Mar, 2023
0
Cobalt is a blue-colored, ferromagnetic heavy metal. It is primarily used in batteries, superalloys, coloring, and chemical processes. It is a toxic, corrosive, and volatile substance in its pure form. It is semi-abundant, naturally combined with other minerals, and requires complex processing for separation. Most of our cobalt today is procured as a byproduct of copper and nickel mining.
Cobalt is crucial to the world economy as we move towards green energy which will depend heavily on rechargeable batteries. Let’s analyze the latest cobalt import export data to get the bigger picture.
The Trade Vision is a premier data provider and market intelligence company with decades of import export experience. Access data on the go with our comprehensive data reports from over 100 countries.
A closer look
“Cobalt” comes from “Kobold” meaning Goblin in German. It was named so because of the arsenic fumes that are released during smelting and their toxic characteristics. Despite its notoriety, cobalt has been found in glass, ceramics, sculptures, and jewelry ranging millennia. From 1500 BCE ancient Egypt to the 1500 CE Ming dynasty China, different cultures have used it aesthetically. It was identified and discovered in 1735 by Swedish chemist Georg Brandt, the first recorded discoverer of a metal.
Export analysis
The cobalt export data shows the many cobalt products, other than batteries, that are exported from different countries. Yet the beginning of this supply chain lies someplace more chaotic. The Dominican Republic of Congo (DRC) is a low-GDP country that owns around 70% of all known cobalt reserves. Much of the population is engaged in hazardous manual mining in detrimental conditions. The US and Canada have safer, more organized operations that use mechanical processes by comparison. In other noteworthy news, Norway has discovered a vast underwater reserve and Finland is becoming a hotspot for future operations.
Top exporting countries (2020)
- Democratic Republic of the Congo ($2.36 billion)
- Canada ($300 million)
- United States ($261 million)
- Norway ($249 million)
- Finland ($199 million)
Import analysis
China and the US have fought trade wars for many years and it's clear who’s won on the cobalt front. China outright owns or has ties to 15 out of the 19 total mines in the DRC. The country is thought to have control over about 75% of the global supply. Control over the cobalt supply is expected to give compounding returns as we shift toward green energy. As seen in the cobalt import data, China, the US, and Japan import cobalt in many forms other than raw materials.
Top importing countries (2020)
- China ($2.6 billion)
- United States ($381 million)
- Japan ($327 million)
- Netherlands ($322 million)
- Singapore ($174 million)
What’s in store?
In 2020, concerns were rising about the levels of Cobalt reserves in relation to decarbonization goals. Political instability in the DRC, hoarding, and mass anxiety led to all-time highs of $80,000/ton. Since then there has been extensive surveying, exchange of information, and development of technologies. Cheaper recycling techniques that give 97% cobalt back from batteries have been developed. In response, cobalt prices have dropped down to about $40,000/ton nearing all-time lows. Currently, there is no shortage in sight.
The situation in the DRC is essential to cobalt’s future. The country does have proper mechanic operations set up by MNCs for their battery needs. Yet the produce from manual laborers is intertwined with the total supply. The white-washed term “artisanal mining” cannot wash away the red tinge of exploitation from the call for green energy. The realities of these mines were uncovered almost a decade ago and are now finally getting mainstream attention. The future of green energy and the blue metal has to be diverted through more sustainable channels.

The white staple is high in demand
6 Mar, 2023
0
Rice is an essential commodity. Half the world’s population depends on it for their daily nutrition. It grows annually, requires high levels of irrigation, and works best in tropical temperatures. The common practices involved in preparing the paddy are labor-intensive and time-consuming. Hence its supply tends to be stagnant in the short term. Let’s analyze the latest rice import export data below to find more details and potential opportunities for your business.
The Trade Vision is a premier data provider and market intelligence company with decades of import and export experience. Access data on the go with our comprehensive data reports from over 100 countries.
How did we get here?
Long before we used to depend on rice as a staple, we used to forage nuts, berries, and animals. Though rice was a carbohydrate-rich cereal packed with a lot more instant energy. It also allowed entire communities to settle down and depend on it instead of having to forage all day. The earliest traces of rice domestication can be found in China around 7000-5000 BCE. Since then people have domesticated many different varieties of rice all over the world. Then by the 1980s, agricultural technology, like high-yielding variety(HYV) seeds and pesticides optimized production, started sustaining yet more people.
Export analysis
Asia’s hot and humid temperature is ideal for rice cultivation. Many countries have been growing rice for several generations with the industry being crucial to their economies. Some countries are renowned for their own varieties. Like India and Pakistan, which are known the world over for Basmati rice. Thailand is home to the famous jasmine rice which we can also see in the rice export data. During the covid pandemic, food insecurity spread all over the world. All of the biggest exporters of rice drastically reduced their rice exports. India was the only exception as its exports have grown to all-time highs and show signs of continuing to grow in the future.
Top exporting countries (2020)
- India ($8.21 billion)
- Thailand ($3.88 billion)
- Vietnam ($2.74 billion)
- Pakistan ($2.14 billion)
- United States ($1.92 billion)
Import analysis
Countries like Saudi Arabia, the US, and Iran import a lot of fancier varieties of rice. As seen in the rice import data, Saudi Arabia has imported Japanese sticky rice, Jasmine, and Basmati. These varieties cost more for fewer quantities and rice is not primarily a staple in these places. Countries like China and the Philippines, on the other hand, have a massive demand for cheaper varieties like broken rice. China is both the leading producer and importer due to its massive demand for rice.
Top importing countries (2020)
- China ($1.72 billion)
- Saudi Arabia ($1.37 billion)
- United States ($1.22 billion)
- Philippines ($1.21 billion)
- Iran ($885 million)
What to expect in the future:
Rice prices have steadily been growing globally and the pandemic wasn’t the only contributing factor. One whole year of the Russia-Ukraine conflict and natural calamities all over the world further exacerbated food insecurity. Pakistan’s production, for example, was also disrupted by the severe floods in 2022. Basmati prices will further increase in March due to increased operational costs in India. India also banned the export of broken rice last year amid shortage concerns over less rainfall in the third quarter.
Ultimately, rice is a human necessity and is not going to go anywhere. Importers should keep an eye on Asian countries neighboring the current leaders like Cambodia, Myanmar, and the Philippines.

Copper is the New Gold
22 Feb, 2023
0
In many ways, copper is like mother nature: versatile, robust, and forgiving. Its properties make it an invaluable and abundant resource. 2.1 billion tons of it are yet to be mined while 700 million tons are currently in circulation. Copper is easy to shape as it is highly conductive to heat and electricity. It is antifouling, antimicrobial, durable, aesthetic, and easily recyclable. With its large reserves and useful qualities, how relevant is it for your trading business? This article looks at and analyzes the import-export data of Copper ore. Read till the end to find crucial information.
The Trade Vision is a premier data provider and market intelligence company with decades of import and export experience. Access data on the go with our accessible and comprehensive data reports from over 100 countries.
Historical perspective
Copper has been essential to us since prehistoric times due to its wide availability and convenience. One of the primary ‘ages’, The Bronze Age, was named after the copper alloy. It signifies just how much copper has influenced our history. Besides being a biologically crucial nutrient, it continues to serve many important roles. From ancient Egyptians, and Romans, to modern-day cultures all over the world. Its extensive use in plumbing, infrastructure, electricity, cooking, and antifouling(preventing the festering of unwanted organisms) has shaped our world.
Export analysis
The usage of copper might be all-pervasive, yet just five countries hold 65% of the discovered resources. We can see this reflected in the copper ore export data. Chile and Peru are geographically located over a volcanic belt that hosts the world’s largest reserve of mineable copper. Australia, Mexico, and the US are the remaining three countries each with its own vast reserve. Mexico also has a long tradition of copper work stretching back to the 18th century. Mining of minerals has long been crucial to Canada’s economy and the government ardently advocates sustainable practices.
Top exporting countries (2020)
- Chile ($21.4 billion)
- Peru ($9.23 billion)
- Australia ($3.85 billion)
- Canada ($3.12 billion)
- Mexico ($2.92 billion)
Import analysis
The biggest usage of copper today is in electrical wiring and infrastructure building. Many Asian countries require the material to develop facilities but do not have any natural sources within their borders. China especially has a massive long-term need for these facilities to support its equally sizable population and economy. We can see in the copper ore import data summary below that it is by far the single biggest importer. Germany, Japan, and South Korea also have highly developed mechanical industries that require new materials for their production.
Top importing countries (2020)
- China ($33.9 billion)
- Japan ($8.51 billion)
- South Korea ($4.22 billion)
- Germany ($2.03 billion)
- Spain ($1.8 billion)
What to expect
Copper prices were recently at an all-time high because of two reasons. Now that China is finally recovering from the latest wave of COVID-19, suppliers expected a massive surge in demand. On top of that, current political unrest in Peru is disrupting supply on a large scale. China is yet to increase demand and copper prices have fallen over the past few weeks in response. Demand is now expected to pick up in the second quarter.
That’s the mid-term scale, but on a long-term scale, copper looks more like gold. There is likely to be a generational shift in copper’s value along with decarbonization. There is a shift that is happening to sustainable energy like wind, solar, etc. and more electric machinery in general. Copper’s overwhelming use in electronics makes it an essential resource for the future. Thus in the long term, copper is likely to become immensely valuable. Countries like Zambia are becoming sought after because of their own copper reserves.

Among the clouds: Aircraft import export data and analysis
13 Feb, 2023
0
Most countries around the world have had soaring dreams of building bilateral exchanges, import export trade, and cultural cohesion with other countries. While some have had these dreams for centuries, others are just starting to see the possibilities of a unified world. Though, there is no doubt that globalization has bound all of us together. Market movements in one country can have a great impact on multiple countries or even the global economy. It is this cohesion that has pushed humankind to the fastest rate of growth that we’ve ever seen. Although many innovations and endeavors have made this possible, one among them stands out as a shining beacon from the sky.
That beacon is an aircraft. For us to find endless trade opportunities, aircraft have allowed transportation at lightning speeds, enabling business operations to spread across continents and newer markets to be established. This has allowed income to be distributed among lesser developed countries and for more people to contribute to the building of civilization.
Exploring new trade possibilities
Not only this, the increased speed of cargo transportation has allowed freight to reach its destination overnight. This has helped us cut lead times and losses due to waste, spillage, breakage, and other perils usually associated with sea and road transport. Aircraft import export trade data informs us of the countries that manufacture aircraft and the countries that are now buying the most to build their fleets.
The growth in aircraft manufacturing and air travel itself was growing from strength to strength until the COVID-19 pandemic hit. According to World Bank data, aircraft passenger numbers stood at 4.56 billion in 2019. A year later, this number dropped by more than 60%.
Aircraft Export Data
Two countries corner close to 40% of the global aircraft and spacecraft export market according to aircraft import export data. These countries are France and the United States of America. This is mainly due to the presence of the world’s two largest passenger aircraft manufacturers namely Boeing (USA) and Airbus (France) that together control 90% production. The battle between these behemoths has pushed aircraft manufacturing to high levels of sophistication. Any change in the trade dynamics of one company affects the other immensely. For instance, America’s trade war with China has cost Boeing billions, as China has had an increased demand for France originating Airbus-manufactured aircraft in recent years.
Aircraft and spacecraft: Top exporters
1. United States ($35.5 billion)
2. France ($31.5 billion)
3. Germany ($28.8 billion)
4. United Kingdom ($12.4 billion)
5. Canada ($9.85 billion)
Aircraft Import Data
While aircraft manufacturing is a two-horse race, commercial aviation is a whole other story. While the aircraft manufacturing market size is limited to under $200 billion, the aviation industry records a whopping market size of $841 billion. China is among the leaders of commercial aircraft importers, owing to its burgeoning domestic aviation industry. Airline operators in Ireland, Malta, and Fiji are also putting major investments in increasing their fleet sizes.
Aircraft and spacecraft: Top importers
1. United States ($27.4 billion)
2. France ($16.1 billion)
3. Germany ($13.6 billion)
4. China ($10.3 billion)
5. United Kingdom ($8.05 billion)
Where the future is headed
The most exciting development in aviation is the billionaire race to get to Mars. With several of the world’s richest people pumping enormous resources into their space missions, the aircraft and spacecraft manufacturing industry is sitting with rapt attention as to what the future brings. If life on Mars becomes a reality in the next fifty years, it will be interesting to see how existing aircraft manufacturers pivot to new demands.

There’s nothing like a wrist watch
31 Jan, 2023
0
Wear the furriest coat, the shiniest pair of pants, or the loveliest shirt made from the finest silk. Wear a sundress, a tunic, a jumper or a skirt. Though, little else can do what a watch will do to your general appearance and countenance. While timekeeping, in general, might end up improving your conscientiousness and punctuality. That is why watches are an age-old accessory popular across regions and cultures. Made primarily from titanium, stainless steel, and ceramic, watches of the pricier variety are also made from precious metals. From an import export perspective, base metals watches and precious metal watches are treated as two different commodities.
It is amusing how time, which is all-consuming and a subject of great wonder, is contained safely in an inanimate watch. A small watch capturing the happiness and anguish that the passage of time leaves us with. But more so, the pure joy that it brings to its wearer is what defines a wristwatch. Let’s dive into the history of watch manufacturing and the import export overview of the clocks and watch market.
Watches: from walls to wrists
Portable time-telling became a reality in the 15th century. But these were mostly pocket watches notoriously prone to breakage and mechanical flaws. Wristwatches didn’t come to market until the 20th century. While before timepieces would be attached to a string-like object and were reserved for the elite, the late 19th century saw military personnel wearing wristwatches to coordinate the time of military maneuvers. Seiko, the watch manufacturer, developed the modern wristwatch around the 1950s.
Wristwatch Export Data
The common wristwatch is quickly getting replaced by a flurry of cheaply available smartwatches. The luxury segment, however, is going from strength to strength. Among the rich, wrist watches are a symbol of opulence and are worn as exquisite jewelry. The market for bejeweled wristwatches is becoming more widespread in the United States and elsewhere in the world. Clocks and watches and parts import export data suggests that watches made from precious or base metals are still produced primarily in Europe (with Switzerland at its helm) , the continent responsible for most portable time-telling inventions.
Top Exporters | Clocks and watches and parts thereof
1. Switzerland ($18.4 billion)
2. China ($4.88 billion)
3. France($1.84 billion)
4. Germany ($1.55 billion)
5. Hong Kong ($1.25 billion)
Top Exporters | Precious metal watches
1. Switzerland ($6.07 billion)
2. France ($673 million)
3. United Kingdom ($529 million)
4. Singapore ($449 million)
5. United States ($443 million)
Wristwatch Import Data
In the modern day, watches have become a method of ornamentation as opposed to a necessity. Thus, higher-income nations are the top importers of the commodity, as confirmed by clocks and watch import export data. Besides, Hong Kong and China are also top importers as well as exporters owing to their massive watch manufacturing industry. A handful of southeast Asian countries and elsewhere, Saudi Arabia and Ireland are rising in watch manufacturing.
Top Importers | Clocks and watches and parts thereof
1. Hong Kong ($5.94 billion)
2. United States ($3.43 billion)
3. China($3.25 billion)
4. Switzerland ($2.72 billion)
5. Japan ($2.17 billion)
Top Importers | Precious metal watches
1. Hong Kong ($2.04 billion)
2. Switzerland ($1.1 billion)
3. United States ($863 million)
4. China ($718 million)
5. United Kingdom ($650 million)
Watch the future
Sustainability is a key concept that will come to define the watch market in the coming years. As Gen Z customers come to the forefront of the consumer economy, the second-hand watch market will provide great opportunities to resellers and marketplaces. The luxury segment will also see growth. The overall outlook on the clocks and watch import export market is brimming with possibilities.

Is the diamond trade booming?
27 Jan, 2023
0
Diamonds were among the top 3% of most traded products in 2020. They are a symbol of eternity, beauty, and quality. Diamonds are also the strongest substance known to man; nothing else even comes close. Diamonds have many industrial uses because of their unique properties. Yet, the diamond import export data suggests that there are some major issues threatening its trade value.
The Trade Vision is a premier data provider and market intelligence company with decades of import and export experience. Access data on the go with our accessible and comprehensive data reports from over 100 countries.
History
Diamonds have always been highly valued because of their visual appearance. They have been treasured by many cultures and have had a few significant sources throughout history. While diamonds are synonymous with quality and value today, they first became popular in India, just after the 4th century. India was a great source of diamonds during that era, after which, Brazil became a major supplier up until the 1800s.
In 1866, a huge diamond reserve was discovered in Kimberley, South Africa. De Beers Consolidated Mines Limited, which later became a prominent diamond supplier, was set up in 1888 in South Africa. By the year 1900, De Beers commanded about 90% of the world’s rough diamond production.
Today, Russia is a major source of naturally mined diamonds.
Export analysis
According to the latest diamond export data, India is the world’s largest cutting and polishing center for diamonds. Low cost of operation, ample high-skilled labor, and cutting-edge technology have allowed it to become so. Belgium’s Antwerp district has also been a hub for the diamond-cutting trade since the 15th century. It produced an important polishing tool, called the scaif, that has transformed the industry.
On the other hand, it was the UAE’s free trade policies that made Dubai a hub for gold and diamond trading. Diamonds in Dubai are about half as cheap as in international markets. While the US doesn’t have enough diamond production to justify its exports, it hosts a vast market for finished diamond products. It owes its exports to refurbished, recycled diamonds, or ones resold at higher prices. Lastly, Israel’s diamond industry has also its roots in history. It suffered greatly during the second world war era, though has recovered since.
Top exporting countries (2020)
- India ($16 billion)
- Belgium ($8.86 billion)
- United Arab Emirates ($7.69 billion)
- United States ($6.65 billion)
- Israel ($5.77 billion)
Import analysis
UAE, Belgium, and India import huge amounts of rough diamonds for cutting and polishing. The diamond import data also tells us that India, Hong Kong, and the US import finished products for their massive consumer populations. Diamonds are deeply rooted in the history of countries like India, Belgium, and Israel. It is a legacy industry with generations of jewelers. UAE, the US, and China have made economic and policy decisions to promote their own consumer markets.
Top importing countries (2020)
- India ($26.3 billion)
- United States ($20.2 billion)
- Hong Kong ($15.4 billion)
- Belgium ($11.5 billion)
- United Arab Emirates ($10.1 billion)
What’s in store?
Russian mining companies have been a major diamond source in the past few decades. Diamond trade has been heavily impacted by sanctions on Russia. Belgium and India have evaded imposing sanctions against Russia until now, but continue to face global pressure. Sourcing and production awareness are increasingly affecting consumer behavior.
Also due to a slacking global economy the demand for this commodity is currently reducing overall. Many people prefer to avoid luxurious purchases in face of dire economic situations. Conventional mining of this rare product is also becoming increasingly uneconomical.
Due to the inherent challenges of traditional mining and developments in research and technology, artificial diamonds are becoming increasingly viable. We can expect to see a huge demand for artificial diamonds in the future.

How sweet is the sugar trade?
13 Jan, 2023
0
To a prehistoric caveman, a spoonful of sugar is like a potent drug. Metabolically, upon ingestion, it would increase their heart rate, dilate their pupils, and cause an instantaneous surge of energy. Sugar is found in all plants in one form or another. When plants photosynthesize the sun’s energy, they use carbon dioxide and water to transform it into different types of sugar. Hence, sugar is the essential vehicle of organic energy. According to sugar import export data, $25 billion worth of sugar was traded in 2020. Scope out the evergreen sugar trade for your business with The Trade Vision.
The Trade Vision is a premier data provider and market intelligence company with decades of import-export experience. Access data on the go with our accessible and comprehensive data reports from over 100 countries.
The Evolution of Sugar
The highest quantity of sugar is found in sugarcane and sugarbeets. They are the two most common raw materials used in sugar manufacturing. Sugarcane was first produced on the island of New Guinea which lies near Australia. The oldest records we have of crystallized sugar production are from the Gupta dynasty in India in 350 CE. Sugar has always been a rich source of carbohydrates and a big part of our diet.
Today, sugar is so prevalent in everything we consume that it has resulted in an increased diet, calorie obsession, obesity, diabetes, etc.
Sugar export analysis
When sugar was first introduced in Brazil, it was more valuable than gold. Since then the industry has been thoroughly optimized. Brazil is not only pioneering sugarcane production and sugar manufacturing but also in producing biofuel from residual waste. Sugarcane farming is exceedingly prevalent in the Indian subcontinent. Substantial investment in the industry after the country’s independence has made it a leading exporter. Low shipping prices and high demand in Asia had spurred Thailand to invest in its sugar production. France is leading in sugarbeets production and has been a historic European leader in the sugar trade. Sugar export data suggests that countries with long-standing access to sugarcane are big players to date.
Sugar: Top exporting countries (2020)
- Brazil ($8.95 billion)
- India ($2.67 billion)
- Thailand ($1.83 billion)
- France ($1.03 billion)
- Australia ($761 million)
Sugar import analysis
The biggest economies of the world have the most significant sugar imports. Here more people are employed in specialized jobs with varied incomes that allow for little to no free time. Sugar is a cheap source of energy and is added to a multitude of packaged edibles. Indonesia is also bumping up its sugar demand to meet its rising consumer spending and manufacturing activities. The same could be said for Bangladesh with its population growth. Looking at sugar import data we can say that developing countries and vast economies are the leaders of sugar demand.
Sugar: Top importing countries (2020)
- United States ($1.95 billion)
- China ($1.86 billion)
- Indonesia ($1.46 billion)
- Italy ($732 million)
- Bangladesh ($752 million)
Sugar: What’s in store?
Global sugar export is expected to rise in the year 2023, with increasing output from Thailand and Brazil. Currently, prices are the lowest in Brazil. Meanwhile, India’s exports are thought to marginally decline due to two reasons. Firstly, a delay in the latest sugarcane crushing period caused by excessive rains. Secondly, the beginning of the biofuel called ethanol, which is also extracted from sugarcane. Fuel with 20% ethanol is likely to be sold in select outlets within the next two months in India. Lastly is the Covid situation in China, where restrictions are currently being eased, which will be an affecting factor in the demand and supply of sugar.

Global Trade Data: What to expect from import export in 2023?
2 Jan, 2023
0
As we enter 2023, the global import export trade landscape is expected to continue to evolve and bind the world’s nations in cohesion. While the COVID-19 pandemic has had a significant impact on international trade in recent years, there are several key trends and developments that businesses involved in import and export should be aware of.
The ‘Online’ boom
One major trend in global import export trade is the increasing reliance on digital platforms and e-commerce. With more and more consumers turning to online shopping, businesses have had to adapt and find ways to sell their products digitally. This trend is expected to continue in 2023, as the shift towards digital channels accelerates. Artificial intelligence and machine learning will further this shift from brick-and-mortal to digital retail.
Sustainability in supply chains
Another key trend is the growing focus on sustainability in international trade. Consumers and businesses are increasingly looking for environmentally friendly products, and many countries are implementing regulations to promote sustainability in global trade. As a result, businesses involved in import and export should consider the environmental impact of their operations and work to reduce their carbon footprint. Marketing methods must be directed to showcase this impact.
Geopolitics
Trade tensions between major economies are also expected to continue in 2023. The United States and China have been at the center of these tensions in recent years, and it is likely that they will continue to impact the global import export market. While the war in Ukraine rages and pushes inflation to record highs in Europe and North America. Businesses involved in international trade must prepare for potential disruptions and be ready to adapt to changing trade policies. A trader must also closely monitor the COVID situation in China.
Technological developments
In addition to these trends, there are several technological developments that will shape the global import export trade landscape in 2023. For example, the use of artificial intelligence and automation in logistics and supply chain management is expected to increase. This could lead to more efficient and cost-effective operations for businesses involved in import and export.
Another important development is the increasing use of blockchain technology in global trade. Blockchain can help to improve transparency and traceability in supply chains, and it is expected to play a larger role in the global import export market in 2023.
The low-down
Overall, the global import export trade landscape in 2023 is expected to be shaped by a range of trends and developments, including the continued growth of e-commerce and digital platforms, the increasing focus on sustainability, ongoing trade tensions between major economies, and technological advances such as artificial intelligence and blockchain. Businesses involved in import and export should be aware of these trends and be prepared to adapt and respond to changing market conditions.

Will the rubber trade bounce back from the current slump?
29 Dec, 2022
0
Rubber's unique physical and chemical properties make it an essential commodity for several industries. From erasers to pipes, to hoses, and even vehicles could not move without this quintessential substance.
Natural Rubber is a polymer, just like plastic, that comes from the rubber tree. It was discovered in the Amazon rainforest and quickly became a powerhouse for the Brazilian economy. A white-colored milk-like substance called latex found in the tree is used to create rubber. Synthetic rubber which is made using petroleum can be used interchangeably with rubber for some of its uses. So prices of rubber are affected by their make in either petroleum or crude oil. The rubber trade industry was worth $12.7 billion in 2020 and the current rubber import export data suggests that the numbers are only increasing.
The Trade Vision is a premier data provider and market intelligence company with decades of import-export experience. Access data on the go with our accessible and comprehensive data reports from over 100 countries.
Highlights from rubber’s resilient history
Rubber has been used long throughout human history owing to its elastic and flexible qualities. Being a polymer, it can be manipulated into any shape or size. It was used in 1600 BC by Mesoamericans in liquid form as a medicine that stops bleeds; for rituals; and for painting. Christopher Columbus is credited with bringing it to the Western world. Natural rubber had certain limitations like temperature sensitivity. It would get sticky in high temperatures and brittle in the cold. This was rectified by the vulcanization process in 1839 by Charles Goodyear.
Rubber: Export analysis
Since the plant was native to the amazon forest, it requires a very specific set of conditions to cultivate and grow. The plant needs consistently high temperatures and high levels of moisture to thrive. The conditions are met near the equator and especially in Southeast Asia where the overwhelming majority is produced. Thailand also has excellent farming practices which made it the biggest exporter of the commodity. Indonesia was second but has fallen back in the past two years due to the poor quality of its material and many other reasons. The Ivory coast had French-owned rubber plantations that were abandoned and taken up by the natives. Malaysia was the second country that led rubber production and replaced Brazil. According to the latest rubber export data, it is still a leading producer.
Top exporting countries (2020)
- Thailand ($3.66 nillion)
- Indonesia ($3.31 billion)
- Cote d'Ivoire ($1.27 billion)
- Malaysia ($901 million)
- Vietnam ($849 million)
Rubber: Import analysis
The US, China, and Japan have huge automotive industries which require rubber for making tires. They also have processing plants that create all kinds of products from the commodity. Due to a lack of rubber production within borders, they depend on imported rubber. Malaysia and Vietnam import processed rubber for the production of goods. This is because they have traditional goods which used to be produced with the local rubber supply. They no longer have efficient processing plants that manufacture usable materials from the raw latex of rubber trees.
Top importing countries (2020)
- China ($3.12 billion)
- Malaysia ($1.41 billion)
- United States ($1.23 billion)
- Japan ($819 million)
- Vietnam ($648 million)
Rubber: What’s in store?
COVID restrictions and disruptions in China are expected to affect rubber prices as the country is the leading importer of the commodity. Over the past two decades, rubber prices have skyrocketed globally only to slump to about one-fifth of previous highs. Currently, rubber prices are at a two year low due to a mismatch between demand and supply. As the world still needs the material for all its uses, the trade is sure to pick up. When it picks up is dependent primarily on the next big COVID wave in China.

Make your business take flight with the soaring aircraft trade
29 Dec, 2022
0
We typically associate airplanes with speedy travel and transportation of goods. Though, it can be easy to miss that planes, that carry all this cargo, are themselves a hot commodity with an enormous market. There are numerous businesses dedicated to the exchange, buying, and selling of these massive flying machines. With The Trade Vision’s free aircraft import and export data, your too can soar high in the world of aircraft trade! Subscribe or book a demo with us to find more leads for your import export business.
Flying elicits infatuation and wonder. We’ve all looked at a bird soaring across the sky and imagined what it would feel like. There’s even a famous Greek myth of a flying man named Icarus who flew too close to the sun. That romance makes smaller planes a highly sought-after luxury for many of us. Airplanes also make it possible to conquer vast distances and trounce transport challenges. As the world becomes smaller and the pace of life increases, the potential for aviation grows rapidly.
The Trade Vision is a premier data provider and market intelligence company with decades of import-export experience. Access data on the go with our accessible and comprehensive data reports from over 100 countries.
Types of aircraft and humble beginnings
There are 3 types of aircraft: Lighter than air crafts like hot air balloons and blimps made from light materials. These are made in great varieties and are popular for recreation. Heavier than air crafts are cargo and military planes. They are the most expensive and highly developed. Civil aircraft are nonmilitary aircraft heavier than air. These are the most common of the three.
The Wright Brothers pioneered aviation in 1903 in America with their practical approach. Their successful attempts made this romanticism with flying a concrete reality. Aviation took off relatively quickly in the following years. Taking flight is widely considered a great milestone in technological development. With it, more and more people have realized that the possibilities are truly endless.
Aircraft export analysis
Let us offer you some essential information that goes beyond our free aircraft export data. France hosts a majority of Airbus’s production and highly trained engineers. The country is focused on the assembly of finished aircraft. While Boeing, the famed American manufacturer, constantly rivals Airbus in business and product development. The United Kingdom leads the design and production of aircraft parts. These include engines, wings, structures, and landing gear. Singapore specializes in refurbishing aircraft. Canada produces smaller executive jet airliners mainly made by Bombardier.
Top exporting countries (2020)
- France ($66.2 billion)
- Germany ($53.2 billion)
- United Kingdom ($43.8 billion)
- Singapore ($20.7 billion)
- Canada ($16.9 billion)
Aircraft import analysis
Countries like the US and China import large numbers of military aircraft to fortify their defenses. Another reason for importing is the popularity of air travel in these countries. The other countries tend to import aircraft to dismantle them and feed their large industries. Aircraft require a lot of expensive resources and are recycled as much as possible. Find more clues about the intricacies of aircraft imports through our free aircraft import data. Subscribe with us to gain more valuable insights.
Top importing countries (2020)
- United States ($73 billion)
- France ($29.9 billion)
- Germany ($29.3 billion)
- China ($23.7 billion)
- United Kingdom ($19.7 billion)
What to expect in the future
Air travel symbolizes freedom from geographical and time-related restrictions. Military jets are the ultimate show of power after nuclear weaponry. There is a huge market for lighter-than-air crafts for individuals to soar across the sky. Highly developed technologies like navigation systems, landing gear deployment, and many others all have their own thriving sectors.
The aviation industry is a long-term one that seems to be less affected by short-term conditions. Electric aircraft, automated factories, and AI-powered research are being utilized to curb long-term challenges. The industry shows little signs of stagnation and seems to have huge potential.

What’s brewing in the Coffee business?
19 Dec, 2022
0
Coffee is one of the most popular commodities in the world. Coffee beans are the seeds of coffee cherry fruits that grow in coffee plants (genus Coffea). There are two types of these plants: Arabica and Robusta. For quick access to the latest coffee import and export data, check out our free information here, and subscribe for more in-depth analysis.
Arabica is grown at higher altitudes (2,000 - 6,500 feet), and requires a lot of moisture, and shaded sun. Its beans are flatter, longer, and yield a more aromatic, mild, yet flavorful beverage. The plant is also more delicate and vulnerable to pests, hence is costlier to cultivate. It accounts for around 75% of global production.
Robusta, on the other hand, is grown at lower altitudes (sea level - 2,000 feet) and is a lot more hardy and robust. It yields a lot more caffeine, is less vulnerable, and is a lot more cost-effective. This variety is preferred for inexpensive commercial instant coffee brands. Accounts for about 25% of global trade.
Coffee cherries are processed to extract the seeds which are then dried. These dried seeds are called green beans and serve as raw materials for further processing like roasting, grinding, and packaging. Coffee has immense value to countless people over the world and has great historical and cultural significance.
The Trade Vision is a premier data provider and market intelligence company with decades of import-export experience. Access data on the go with our accessible and comprehensive data reports from over 100 countries.
Coffee: A rich history
The Coffee plant can be traced back to Ethiopia, East Africa. According to an Ethiopian legend, a goat herder noticed his goats were unusually energetic after grazing from a certain bush. They were even unable to sleep at night. He told an abbot from the local monastery about the bush, who made a concoction out of it. The abbot discovered that the black drink kept him alert during long hours of worship. He shared his discovery with other monks. Thus, the knowledge of the rejuvenating berries spread, all the way to the Arabian peninsula.
The black beans were met with much controversy as Muslim countries sought to ban the beverage. While the authorities considered its effect intoxicating, the drink became a mainstay for the people. Coffee houses started opening up where people would converse enthusiastically in the evening over its stimulating effects. These coffee houses became social and cultural hubs and started to get dubbed as “Schools of the Wise”.
The drink spread throughout Europe in a similar fashion where it replaced beer and wine as a breakfast beverage. From there it traveled worldwide to become a common household ingredient all over the world.
Coffee: Export overview
All of the coffee grown on Earth is cultivated in an area around the equator called the Coffee Bean Belt. This area between the tropics of cancer and Capricorn has ideal conditions to grow coffee. It is no surprise then, that a large part of coffee export data points to sources in this area. Brazil has long been the leading producer of coffee ever since the 1840s and has a long history with the trade. A large part of the coastal area has been growing coffee since the first bush was famously planted in 1727. Brazilian coffee has since prospered after a surge of immigrants in the 19th century that came to grow it.
Vietnam’s coffee plantations have long been a major economic force in the country. After the war and during the reforms coffee was valued as second only to rice. Switzerland is home to Nestle and has some of the world’s biggest coffee processing plants. Despite never growing a single bean in the country, Swiss coffee beans sell for a premium price. Switzerland has managed this feat through great business practices and highly developed products. Colombia is famous for producing mild and well-balanced beans. Coffee beans are the number one export of Honduras which has ideal conditions for its cultivation.
Top exporting countries (2021)
- Brazil ($5.8 billion)
- Columbia ($3.1 billion)
- Switzerland ($2.6 billion)
- Vietnam ($2.3 billion)
- Honduras ($1.3 billion)
Coffee: Import overview
Global coffee import data has a long history just like the export leaders. The exporting countries have large industries and a long history with the black bean. Similarly, the countries that import it have a long cultural history with this commodity. Coffee is an inseparable part of people’s lives in all these countries and has been so for many years. In the US, The Boston Tea Party tied the beverage to patriotism. ‘Starbucks’ a premium coffee retailer and cafe house is also of American origin. Italy, France, Belgium, and Germany also have a tradition of coffee drinking ever since the plant first made its way to Europe.
Top importing countries (2021)
- United States ($6.9 billion)
- Germany ($4.1 billion)
- France ($3.1 billion)
- Italy ($1.7 billion)
- Belgium ($1.43 billion)
Coffee: What to expect
The growth of the coffee industry has been declining for the past few years and bean prices have been reducing. Arabica prices have now fallen to lower than Robusta which indicates the reducing demand. People are becoming more aware of traditional and artisanal ways of brewing. While demand for these specialized products might increase, things seem uncertain for now. Similarly, good quality coffee might get cheaper than ever, so instant coffee might see decreased demand. As the world faces a recession in the US, inflation in Europe, and the war in Ukraine, industry leaders are conservative in their short-term estimates. Some experts expect a rise from 1% to 2% in annual growth.

Silicon, semiconductors, and our future
14 Dec, 2022
0
Silicon is an essential resource for technology. It is used to make semiconductors for mobile phones, computers, solar cells, and silicon wafers. Silicon wafers are what we call computer chips. This article focuses on pure silicon as a raw material, as well as the technology components made from it.
Pure silicon is a metalloid that is hard and dark gray with a metallic luster. It has the same microscopic structure as a diamond and shares many physical and chemical properties with it.
It is the second most abundant element on Earth, found in almost all rocks, soils, clays, and waterbodies. It is the biggest component of sand, which is plentiful, easy to mine, and comparatively simpler to process. This makes sand the primary source for extraction. Quartzite, sandstone that has been converted into a solid quartz rock, is another major source.
The essential nature of this element in our technology makes silicon import export data crucial in the present and future. Awareness about the channels of distribution and potential future opportunities can give an edge to any B2B trader in electronics. Subscribe to The Trade Vision for detailed information.
A brief history
Silicon was familiar to predynastic Egyptians who used it for beads and small vases. They also made glass containing silica, which is a natural compound of silicon combined with oxygen. Many other ancient civilizations including China made similar usage of the material. Its many naturally occurring compounds called silicates were also used in various kinds of mortar for construction. It was discovered by Jons Jacob Berzelius, a Swedish scientist, in 1824.
Silicon export analysis
There are many nodes on Silicon’s channels of distribution. From the sands and other raw materials to their pure form used in manufacturing. Countries like the US, Germany, and Japan have been experiencing a tech boom since 2010. A surplus of pure silicon imported to meet the high demand for semiconductors will lead to an increase in future exports. Malaysia is home to suppliers and semiconductor makers as well as global chip assembly testing factories. It accounts for a sizable portion of the world’s semiconductor trade. Taiwan is the world’s leading computer chip fabricator by country and produces a large number of semiconductors. Explore our free Silicon export data and subscribe for more detailed information,
Silicon top exporting countries (2020)
- United States ($828 million)
- Germany ($815 million)
- Japan ($315 million)
- Malaysia ($209 million)
- Chinese Taipei ($173 million)
Silicon import analysis
Back in 2017, China was the leading manufacturer of silicon-based products. Unexpected drops in demand and political factors led to a decrease in production. Now China largely depends on imports from Taiwan for their massive technological industries. Japan and Taiwan require pure silicon as raw materials for their vast computer chip industry. South Korea requires semiconductors for its gadget industry and Germany for their auto industry. Browse our free silicon import data and find more leads for your trading business.
Silicon top importing countries (2020)
- China ($942 million)
- Japan (576 million)
- Chinese Taipei ($252 million)
- South Korea ($227 million)
- Germany ($175 million)
Silicon: What’s in store?
Political friction between the United States and China has accumulated into an Economic trade conflict between the two. Dubbed ‘Chip Wars’, it is considered crucial to future global commerce. This conflict will vastly influence trade in this commodity. Recently the US placed trade restrictions on China for the trade of a type of computer chips. This was done in response to policy decisions by China against the US.
Overall demand for silicon is expected to rise over time as demand for specialized semiconductors skyrockets all over the world. Semiconductors are considered as important to the economy now as crude oil was a hundred years ago. Companies are looking for purer and more cost-effective ways to mine and extract silicon. As mining practices become more sustainable, the production of semiconductors will be key in the future.
The Trade Vision is a premier data provider and market intelligence company with decades of import-export experience. Access data on the go with our accessible and comprehensive data reports from over 100 countries.

Growth Potential of the Plywood Market
29 Nov, 2022
0
Construction activities and furniture production are surging globally with increased urbanization in developing and developed nations alike. This leads to an increased demand for raw materials too. Different architecture and design challenges require materials with specific qualities. Plywood is an increasingly popular building material for several reasons. The different types are based on their wood, adhesive, coating, number of layers, and manufacturing processes. Most are non-reactive, flexible, insulated, lightweight, and cost-effective. All this makes plywood a widely used building material.
Plywood is manufactured by peeling off thin layers of veneers from tree trunks. The veneers are cut as required and glued together at right angles atop each other with adhesive. A thin layer of resin or other coatings may also be applied to improve durability, aesthetics, etc. They are also widely used in the marine sector, as they can withstand occasional water exposure. The current prevalence of this commodity and the predicted growth of its sector make plywood import export data a must-have for any construction and manufacturing business.
The Trade Vision is a premier data provider and market intelligence company with decades of import-export experience. Access data on the go with our accessible and comprehensive data reports from over 100 countries.
A history of plywood
Plywood is one of the oldest “engineered wood” products and has always been a valuable resource. It was used in ancient Egyptian, Greek, and Roman civilizations. Wood was cut thinly and glued together to avoid wastage through trimmings. This was initially done for economic and aesthetic purposes. It then became common practice owing to the versatility of the material. Unlike fine wood, plywood’s flexibility made it resistant to breakage. As its potential grew, plywood was introduced in industrial processes too. The first standard-sized plywood sheets (4x8 ft) were introduced in the US in 1928.
Plywood export analysis
Plywood does not require a complex procedure to produce. China has ample industrial capability and enough land to cultivate both soft and hardwoods. That is why it's by far the biggest exporter. Deforestation is very lucrative for developing economies. They tend to have vast unprotected wildlands. There are dual short term benefits for clearing these wildlands. The wood can be utilized as a resource and the empty land can serve more financially beneficial endevors. This is the position the other countries on the list find themselves in. Data suggests that Vietnam might be a future leading exporter worth keeping an eye on.
Top plywood exporting countries (2020)
- China ($4.71 billion)
- Indonesia ($1.83 billion)
- Brazil ($513 billion)
- Malaysia ($369 million)
- Vietnam ($305 million)
Plywood import analysis
Some of the most developed countries were the biggest plywood importers in 2020. This might be due to how hardwoods are mainstream in interiors of all kinds. From buildings to homes, to cars, and even boats, wood gives a very luxurious feel while being lightweight and inexpensive. That is why some of the largest capitalistic hubs of the world are increasingly using this commodity.
Top plywood importing countries (2020)
- United States ($2.75 billion)
- Japan ($1.25 billion)
- Germany ($932 million)
- South Korea ($721 million)
- United Kingdom ($628 million)
Plywood: What’s in store?
People in developed countries are becoming more environmentally aware and exploring sustainable materials for all their needs. This is out of necessity as synthetic materials are compounding the damage to us and our surroundings. Yet wood is still widely considered acceptable as a lesser evil. Other than this anecdotal observation, urbanization is happening all over the world in developing countries. Thus most experts stipulate that the market for plywood will naturally grow as well. This makes sense as historically all developing countries have followed the major economic trends of leading countries like the US, UK, Germany, and Japan. As the plywood industry looks towards robotics to increase productivity, this commodity is definitely going to go from strength to strength.

What is the state of Gold right now?
24 Nov, 2022
0
The deeply emotional, fiercely cultural, and highly valuable commodity of gold is an evergreen precious metal. Its surface beams with otherworldly brilliance. It is used to make jewelry all over the world. Be it a simple ring or an ostentatious Indian adornment, every occasion is incomplete without gold. It’s widely considered a surefire investment that people use to diversify their portfolios. Its physical properties like nonreactive stability make it long-lasting in nature. Similarly, its monetary value never fades and only seems to grow with time. Hence it doubles as a status symbol and as a tool to grow wealth. It is used also in prevalent technologies like semiconductors and thin bonding wires.
All these factors make gold one of the most traded materials after crude oil. Central banks also use it as security to back up their reserves. Explore our free gold import and export data and subscribe for more in-depth information.
The Trade Vision is a premier data provider and market intelligence company with decades of import-export experience. Access data on the go with our accessible and comprehensive data reports from over 100 countries.
A brief history
We have always cherished natural beauty in all shapes and forms. Especially in small objects which can be owned and possessed. This is true for gold, just as it is true for diamonds, rubies, seashells, and even colorful feathers of tropical birds. Gold has been used ornamentally and as a currency for about 6,000 years. Its use as a currency is typically associated with medieval civilizations. Yet the gold standard has also played a big part in modern financial history. At the end of WWII, the Bretton Woods system was created to promote stability and amend the Gold Standard.
Gold export analysis
Gold is traded on a large scale and is prone to fluctuations in supply and demand. Subscribe to unlock full access to our gold export data for more information. Switzerland tends to have a large reserve owing to its vast watch market and banking sector. China is one of the biggest markets for gold owing to its coveted cultural value and vast population. Other countries like UAE which have crude oil are rich economies with extensive gold reserves. Wealthy countries tend to have large gold reserves.
Top gold exporting countries (2020)
- Switzerland ($68.5 billion)
- Hong Kong ($33 billion)
- United Arab Emirates ($28.8 billion)
- Russia ($18.7 billion)
- Australia ($17.7 billion)
Gold import analysis
Rich countries in the west have enormous gold reserves to maintain fiscal stability. Islamic countries like UAE and Turkey, on the other hand, have a long and traditional relationship with the precious metal. These countries have a huge jewelry market that is crucial to their economy. In Turkey, oftentimes the monthly rent is charged in terms of gold. Turkey also has a growing gold mining industry.
Top gold importing countries (2020)
- Switzerland ($87.4 billion)
- United Kingdom ($83.7 billion)
- United States ($48.2 billion)
- United Arab Emirates ($38.4 billion)
- Turkey ($23.7 billion)
What to expect
According to the Bank for International Settlements, between the period of 2012-2020, 51% of above-ground gold was tied up in jewelry. Meanwhile, 26% was in Bars and coins, 8% in technology, 3% in securities, and 12% in central banks. Gold demand saw a sharp rise after the pandemic. This underlines its status as a secure investment.
The International Council for Mining and Metals has declared its support to decarbonize the mining industry in line with the Paris Agreement. Sustainability and responsibility principles as well as climate adaptation and resilience strategies are the topics of discussion around the precious metal. Subscribe to our service to get more insight about the current biggest importing and exporting opportunities around this valuable commodity.

Behind the scenes: the most important global industry
16 Nov, 2022
0
Consider this. The world of medicine is a stage play. Who is the playwright? The producer? The director? Medical professors, universities, and researchers. Who are the actors? Doctors and nurses. The audience? Patients from different walks of life sit on velveteen seats, enraptured by a splendid (sometimes confusing) performance.
But, up there on the balconies are the people who make or break the show. Who are they? The critics. And in what form do these critics present themselves in medicine? Pharmaceutical companies.
The business of medicine
The business of medicine is enormous. Most recently, the COVID-19 pandemic highlighted how ‘big pharma’ controls the production and distribution of essential medicines. The nexus between power and pharma shows how pharma companies make billions while the poorest in the world remain unvaccinated.
Though these are just a few bad (albeit enormously sized) apples. The business of medicine is uplifted by the presence of nonprofits, universities, and conscientious government departments. These are the people that help medicines reach those that need them the most. Pharmaceutical global trade volume stood at $667 billion in 2020. By every estimate, pharmaceuticals are one of the top exported products in the world.
Pharmaceutical export analysis
Most top medicine manufacturers operate in Europe and North America. This makes countries and companies in these regions top medicine producers. The World Health Organization (WHO) is headquartered in Geneva, Switzerland. Pharma companies in Europe use this proximity to lobby regulations. The famed automaker, Germany, is also the top pharmaceutical exporter in Europe and the world. Although Asian players like India and China are making great headways in becoming the leaders in generic medicines. Access this free version of pharmaceutical export data.
The Trade Vision is a premier market intelligence company with a far-spreading reach in the world of EXIM trade. For decades, we have helped import and export companies scale their operations to new jurisdictions. Contact us now at mywishplan@thetradevision.com or call +1(307)7573116 to get started.
Download The Trade Vision Mobile App to access data on the go.
Top export countries
1. Germany ($99.5 billion)
2. Switzerland ($77.9 billion)
3. Ireland ($67 billion)
4. United States ($60.4 billion)
5. Belgium ($44.4 billion)
Pharmaceutical import analysis
Though Europe corners production, the biggest market for pharmaceuticals is the United States of America. The US is also a major producer of pharmaceuticals but most of its produce is meant for the domestic market. Mass commercialization of medicines in the US is a pressing concern. Only recently, a ‘big pharma’ company was charged with overpromoting their pain-relief medication and fuelling an opioid crisis that has claimed thousands of lives.
Top import countries
1. United States ($134 billion)
2. Germany ($60.5 billion)
3. Switzerland ($39 billion)
4. Belgium ($35.7 billion)
5. China ($30.8 billion)
Pharma: The low-down
Manufacturers must focus on selling their medicines to the countries that need them the most. Not those who can pay the most. The new world order of the internet demands transparency in all spheres of business. Governments must look to engage with pharma producers on a minute level. With the internet has come the extreme sophistication of marketing. This is another area that demands strict oversight and regulation on the part of government agencies.

Where flow the rivers of chocolate?
1 Nov, 2022
0
The shelves of a home fridge are incomplete without a dash of chocolate: be it in a bar, a cookie, an ice cream or a cake. Chocolate is considered a delicacy the world over. The smallest celebration and the largest gala alike is most often celebrated with chocolate. In a world divided by frontiers, languages, people, and politics, chocolate is the most understated unifier.
Besides being a treat for the palette, chocolate has several health benefits for the young and old. When consumed in moderation, chocolate(more specifically dark chocolate) helps improve heart health, balances the immune system, improves athletic performance, and has a host of other benefits. Though, mass marketing and cheap production has made chocolate a contributor to diabetes, obesity, and gum and mouth diseases, particularly in the young.
Where does chocolate come from?
Ancient mesoamericans(in present day Mexico) were the first to discover cacao and its variety of uses. They consumed chocolate as a ritualistic and medicinal drink. Though it was the Mayans and the Aztecs a little later who uplifted chocolate to the prominence it holds today. Sources suggest that cacao beans were even used as a currency. Chocolate reached Europe through a Spanish explorer and was welcomed immediately by the people.
Chocolate export analysis
The popularity of chocolate in Europe has achieved a frenzied pace through the years. Intrinsically warm and salubrious, chocolate helps the continent bear the worst of the winter. It works as an energizer and a relaxant. It is for this reason alone that a few European countries corner most chocolate production in the world, even though chocolate was first cultivated in South America. Besides these two regions, chocolate is also widely cultivated in West Africa.
Chocolate's ubiquity and popularity makes it an essential commodity for agricultural traders to tap into. Find a free version of chocolate import export data at this link. The Trade Vision gives you unlimited and seamless access to import export data from 100+ countries. We are a premier market intelligence company that has helped thousands of businesses up their exim game.
These are the top chocolate exporting countries in the world:
1. Germany ($4.98 billion)
2. Belgium ($2.7 billion)
3. Italy ($2.11 billion)
4. Poland ($2.03 billion)
5. Netherlands ($1.76 billion)
Chocolate import analysis
There is a major difference between the chocolate products of Europe and the chocolate products of the United States of America, the latter of which is the largest importer of chocolate. In North America, most products are commercialized to no end. They are sweetened, mixed with dairy and other additives that make them marketable but extremely unhealthy. Due to the global influence of the American markets, these are the products that are sold most popularly worldwide. Though in Europe, chocolate is served unsweetened and the most common form is dark chocolate, which is also the healthiest.
These are the top chocolate importing countries in the world:
1. United States ($2.9 billion)
2. United Kingdom ($2.31 billion)
3. Germany ($2.24 billion)
4. France ($2.2 billion)
5. Netherlands ($1.38 billion)
Where’s in store for chocolate traders?
As we move towards being healthier in the post-pandemic world, less sugary chocolate and finer derivatives are set to be more in demand. We must take European chocolate producers seriously and watch out for healthy developments in the American food market.

Mobile Phones: a Downturn for The Necessary Luxury
27 Oct, 2022
0
A piece of technology is subject to controversy in proportion to its prevalence. It is hard to find a more common controversy than the cell phone. As social animals, we depend on each other for everything. Cell phones were invented to make that process easier. They improved the channels of communication that existed before. Today, people organize all their activities via mobile phones. Yet the narrative around them is a mixed bag.
On one hand, they are clocks, navigational devices, and our personal assistants. On the other, they are associated with addiction, alienation, and mental illnesses. Double-edged swords must be used carefully especially when they become necessary. But for cell phone importers and exporters, the air is optimistic with opportunity. As the device’s use spreads to the farthest corners of the world, Cellphone import export data shall provide invaluable opportunities to traders.
We at The Trade Vision have comprehensive data reports from over 100 countries. We are a premier data provider and market intelligence company with decades of import-export experience.
Mobile phone history
Certain milestones in technology have led to the modern mobile phone. They were first envisioned in the early stages of radio engineering. After the Second World War, radio technology was further developed into 0G. 0G comprised of two rather inefficient and expensive systems that failed to become feasible. From there came the car phone and onwards to the first handheld mobile made by Motorola. This was followed by the internet, 1G, 2G, 3G, and the smartphone by Apple. This common household sophisticated gadget is the result of decades of different technologies and infrastructure building upon each other.
Mobile Phone export analysis
The cell phone export data indicates that in 2020 more than 80% of the commodity’s exports were from Asia. China has been widely regarded as the factory of the world in the 2000s. Many new contenders are currently rising in export of cell phones. As a first, India exceeded $1 billion worth of mobile phone exports this year in the month of September. The development of 5G infrastructure is ushering the market’s growth in many countries including India.
Top export countries (2020)
- China ($51 billion)
- Vietnam ($21.4 billion)
- South Korea ($12.9 billion)
- Mexico ($11.6 billion)
- Hong Kong ($4.58 billion)
Mobile Phone import analysis
China has the biggest cellphone market accounting for the highest cellphone imports. This is due to the large population of all and its massive manufacturing sector that imports mobile components. The same could be said for Hong Kong which is a business hub. Vietnam is also a big manufacturer that has grown immensely after 2020.
Top import countries (2020)
- China ($19.6 billion)
- Hong Kong ($18.2 billion)
- Vietnam ($16.5 billion)
- United States ($12.9 billion)
- Mexico ($7.89 billion)
Mobile Phones: What’s next?
Industry leader Apple is decreasing the production of its latest iPhone 14 Plus due to a lack of demand. This is due to decreased demand for high-value consumer goods all over the world. Many experts suggest that this trend will likely continue over the next 6 to 9 months. Though there is an expectation of a temporary spike during the holiday season. Sales have already increased in India during the Diwali festival after 2 years of lull festivities due to lockdowns. Some Asian countries like Vietnam prepare for this expected lull in the high-value consumer goods market. The slowing down of the global economy and the expectation of a recession might have also contributed to these conditions.
Contact us now at mywishplan@thetradevision.com or call +1(307)7573116 to get complete access to cellphone import and export data.
Download The Trade Vision Mobile App to access data on the go.

Building a brighter tomorrow in Cambodia
20 Oct, 2022
0
Cambodia is a coastal nation in Southeast Asia. It is a rising middle economy, ranking 107 in GDP terms. Cambodia's geography constitutes forests, great rivers, plains, mountains, and the Gulf of Thailand coastline. The emerald green terrain hosts few developed cities among vast rural areas. Most of the population is engaged in agriculture, fishing, and animal herding. The people are finally adjusting to a peaceful life after decades of instability. The Khmer Rouge, a communist guerrilla movement that ruled the nation between 1975-79, had left Cambodia distraught.
During the four year period, at least 1.5 million Cambodians were killed or had died of natural causes precipitated by the regime. National infrastructure was devastated as well as the education system, while the strength of domesticated animal species dwindled, and all else went wrong. Many people had to flee the country and seek refuge elsewhere. Having regained political autonomy only in the 1990s, Cambodia’s dark past is still far from forgotten. While under French rule, Cambodia was invaded and occupied by the Japanese during World War II. This was followed by a sporadic periods of postwar independence and civil conflict leading up to the Khmer Rouge.
Today, tourists visit Cambodia to pay their respects at the Angkor Wat temple complex, a highly celebrated archeological site. The temple is a remnant of The Khmer civilization that met its end in the 16th century. Influences from Indian, Chinese, Vietnamese, Thai, and French cultures have helped shape the country as it now is.
Cambodia Export Overview
Agriculture is still the most important sector of this rural economy. Yet the majority of the indigenous soil is sandy and lacks nutrition. Rubber, cotton, and rice have been the biggest commercial crops for decades. Rice being the most commonly grown. In the absence of infrastructure for proper irrigation, rice is sown primarily during the monsoon. Almost all farmers are also engaged in fishing, animal husbandry, and fruit cultivation. Most of this is used to meet local demand and personal needs. Other important crops include coconut, cassava, sugarcane, corn, soybean, and tropical fruits. Three-fourths of the land used was forested in the 1970s. Today about half of that has been cleared making deforestation a huge issue.
In the 1990s, the government made intensive efforts to invite foreign investment into Cambodia. As a result, the hospitality, tourism and textile industries thrive in Cambodia. Manufacturing of sweaters, suitcases, and clothes has become a popular line of work. Gain access to textile export data from Cambodia at The Trade Vision. We have extensive resources on Cambodia's real-time trade developments.
Cambodia: Top Export Commodities
- Gold ($5.25 billion)
- Knit Sweaters ($2.15 billion)
- Knit Women's Suits ($1.55 billion)
- Trunks and Cases ($1.46 billion)
- Non-Knit Women's Suits ($1.44 billion)
Cambodia: Top Export Countries
- United States ($7.25 billion)
- Singapore ($5.07 billion)
- Germany ($1.84 billion)
- Japan ($1.63 billion)
- China ($1.46 billion)
Cambodia Import Overview
The country has had to depend on its neighbors and developed nations for many things over the last fifty years. In Cambodia, there is no scope for commercial mining. The country also faces shortages of energy materials, including oil and gas. Earlier, in the 1990s, there was a boost in import of consumable goods like soft drinks, paper, and cigarettes. Electronics and cars were also vastly imported during this period.
Except for a couple major cities, transport in most rural areas is done by bicycles. Hence, bi-wheel components are vastly imported even today. Fabrics are also imported as raw materials for the clothing industry. Explore Cambodia import data to make better trading decisions for your business.
Cambodia: Top Import Commodities
- Light Rubberized Knitted Fabric ($2.08 billion)
- Refined Petroleum ($1.82 billion)
- Gold ($1.43 billion)
- Bi-Wheel Vehicle Parts ($517 million)
- Cars ($450 million)
Cambodia: Top Import Countries
- China ($8.07 billion)
- Thailand ($5.74 billion)
- Vietnam ($4.39 billion)
- Singapore ($1.59 billion)
- Chinese Taipei ($750 million)
Cambodia: What’s In Store?
Cambodia continues to heal from the bloodshed unleashed by the Khmer Rouge. Underdeveloped medical services and outdated education systems also hamper the Cambodian people. Due to porous borders, goods are often smuggled freely through Cambodia's frontiers. Wildlife is at risk and deforestation is rampant. The people struggle to make ends meet. The government therefore faces complex challenges that require steadfast action.
As most of the population is engaged in agriculture and lives in rural areas, city life is very different. Looking at global headlines, Cambodia’s name most often comes up in organized crime-related news. Gambling rackets, human trafficking, scam companies, and political espionage are only a few examples. A 95% indigenous population has led to a strong sense of national identity. The people still struggle to adjust to their new global position and learn to find their place. Moving towards the future, the development of basic infrastructure and administrative systems will be the biggest determinants.
Currently, there is stagnation in the Cambodian textile sector due to a lack of orders. The strain on the world economy caused by the Russia-Ukraine War might be a contributing factor. Tourism is currently the fastest-growing industry in the country. Expand your business operations to Cambodia with assistance from The Trade Vision. We are an international trade research company and provide actionable analytics that steers clear of the noise.
Contact us now at mywishplan@thetradevision.com or call +1(307)7573116, to get started.
Download The Trade Vision Mobile App to access data on the go.

Sunflower oil: A sight, a musk, a staple
17 Oct, 2022
0
A radiant field of sunflowers has attracted the fancy of many an artist. Most famously, Vincent Van Gogh made an entire series of paintings on the sunflower. The wondrous yellow pools find their way into verse, paintings, politics, and almost all other walks of life. This is no coincidence. Besides serving the senses of sight and smell, sunflowers have several functional purposes.
For starters, sunflowers have a variety of uses in agriculture. The petals make dyes. Sunflower seeds are famed for being highly fibrous, antioxidant, and anti-inflammatory. Sunflower seeds also contain the sweet sunflower oil that is consumed the world over as a cooking staple. Its overreaching popularity makes sunflower import export data a necessity for agricultural importers and exporters.
The Trade Vision is a premier data provider and market intelligence company with decades of import-export experience. Access data on the go with our accessible and comprehensive data reports from over 100 countries.
The sunflower crop: A History
Sunflowers were first grown in North America by indigenous tribes thousands of years ago. Due to religious restrictions, sunflower cultivation proliferated majorly in Ukraine and Russia through the early 1800s. The trend continued until the beginning of the war in Ukraine. The two countries combined cornered about 75% of the world’s export market. But harvests were impacted deeply by the conflict. As a result, food security took a hit in several countries around the world. Europe saw record spikes in food oil prices. Africa struggled to fulfill oil demands. Shortages were also worsened by poor soy output across the world.
Sunflower export analysis
The sunflower oil export market recently received an optimistic update. Ukraine has resumed supplies helping slash sun oil prices by nearly half since April. The development came about as Russia and Ukraine signed a Turkey-brokered grain deal to let crop exports pass unharmed through the black sea. Before the war, India was Ukraine’s largest buyer. Later, India shifted its demand to Russia and Argentina. As did most others hit by the high prices. Although in recent weeks, export demand for Ukrainian sunflower oil has been rising sharply.
Top sunflower oil exporting countries (2020)
1. Ukraine ($4.71 billion)
2. Russia ($1.83 billion)
3. Netherlands ($513 million)
4. Bulgaria ($369 million)
5. Argentina ($305 million)
Sunflower import analysis
Being the top two most populous nations in the world, India and China account for the highest imports of sunflower oil. This is because the rising middle class in these nations has adopted sunflower oil as their primary cooking oil. The nations are also in close geographic proximity. Besides, Ukraine and Russian sunflowers feed people in Europe and Africa, as well.
Top sunflower oil importing countries (2020)
1. India ($1.9 billion)
2. China ($1.53 billion)
3. Netherlands ($618 million)
4. Turkey ($596 million)
5. Italy ($484 million)
Sunflower oil: What’s in store?
As the Russian offensive becomes meeker by the day, sunflower oil traders are beginning to look forward to an optimistic future. Ukraine’s ability to supply is met decisively by global demand. Rising food costs are likely to be controlled in the coming months. But, as is with most things geopolitics, only time will tell if this comes true.

Time to Watch the Swiss Market
3 Oct, 2022
0
The Swiss Confederation is a small country with a modest population. Yet it is also one of the wealthiest countries in the world. Lying in Central Europe, it was an economically important crossing point in the 13th century. This meant that Switzerland was founded upon a pact of mutual assistance. Its well-known neutrality and independence have long since been honored by the major European powers. It wasn’t involved in the two World Wars and isn’t a member of the European Union. As a result, it is a popular location for international organizations’ headquarters. Renowned for its natural beauty and way of life, Switzerland is full of glacier-carved peaks and deep Alpine Lakes. Its spectacular valleys are dotted with neat farms, villages, and thriving cities that blend old and new to make it a sight to behold.
The tourism and banking sectors have had a significant role in the overall Swiss economy. The country’s central location along international trade routes and lack of raw materials promote commerce and transport. Secondly, the country has a skilled, efficient, and highly educated workforce with an output too big for its domestic market. Thus, the economy is built around importing raw materials and converting them into high-quality, high-value-added finished products for export.
Switzerland has the world’s second most complex economy and was the third happiest nation in 2021. Being a developed country, only about 2% of the population is engaged in agriculture. While a larger minority of about 30% are in the Manufacturing sector. The service sector stands as the top employer, cornering about 68% of the workforce. Switzerland is infamous for its financial sector that provides discreet banking to high income individuals from all over the world. Besides that, Swiss chocolates, dairy products, knives, and especially watches are a favorite with global consumers. The country is home to Nestle, a global FMCG conglomerate. The country is also a coveted tourist destination, and boasts of one of the most competitive pharmaceutical industries worldwide.
Switzerland Export Overview
Gold and Base Metal Watches are part of the Swiss watchmaking industry. Nitrogen heterocyclic compounds are used in antibacterial and vaccine production. Switzerland has two of the biggest pharmaceutical companies in the world. The Trade Vision has extensive resources that inform traders of real-time trade developments in Switzerland. Buyers and Suppliers across the world have expanded their operations using data and marketing intelligence reports from The Trade Vision.
Switzerland: Top Export Commodities
- Gold ($68.5 billion)
- Packaged Medicaments ($46.3 billion)
- Vaccines, blood, antisera, toxins, and cultures ($30.2 billion)
- Base Metal Watches ($11.5 billion)
- Nitrogen Heterocyclic Compounds ($11.4 billion)
Switzerland: Top Export Countries
- United States ($62 billion)
- Germany ($49.2 billion)
- China ($17.3 billion)
- France ($16.3 billion)
- United Kingdom ($14.5 billion)
Switzerland Import Overview
The population is very active within the government. Policy decisions that promote sustainable food culture have led to a largely independent food sector. About 90 to 100% of pork, veal, cattle, and milk products consumed are produced within the country. Beyond that, Swiss agriculture meets 65% of the domestic food demand. Due to a lack of natural resources, most imports are used for domestic production.
Switzerland: Top Import Commodities
- Gold ($87.4 billion)
- Packaged Medicaments ($26.6 billion)
- Vaccines, blood, antisera, toxins, and cultures ($11.8 billion)
- Cars ($9.65 billion)
- Jewelry ($7.83 billion)
Switzerland: Top Import Countries
- Germany ($62.7 billion)
- Italy ($25.1 billion)
- United States ($19.7 billion)
- France ($16.3 billion)
- China ($14.9 billion)
Switzerland: What’s In Store?
Chemicals and pharma drove Swiss exports’ growth in 2021. Luxury watches also had a great year. Exports came to a total value of $284.5 billion in 2021, marking a 15.2% increase in the pandemic year 2020. With imports also climbing, but less markedly, to $203 billion, 2021 ended with a trade surplus of $81 billion, up from $43.5 billion in 2020.
Chemical and pharmaceutical products accounted for just over half of the total volume of exports; the value of this industry rose by 12.4%, with exports of immunological products notably rising for almost a quarter. As for imports, one remarkable progression last year was the big jump in energy imports, which rose by almost 70% to just under $10.1 billion – a rise explained “exclusively” by higher prices rather than volumes.
Expand your business operations to Switzerland with assistance from The Trade Vision. We are an international trade research company, and we provide actionable analytics that steers clear of the noise.
Contact us now at mywishplan@thetradevision.com or call +1(307)7573116, to get started.
Download The Trade Vision Mobile App to access data on the go.

Mauritius: Keeping Heaven Afloat
3 Oct, 2022
0
Mauritius lies off the coast of East Africa in the Indian Ocean near Seychelles and Madagascar. This volcanic island is bursting with natural wonders like mountains, forests, and beaches. The paradise on Earth was an untouched Eden when Dutch settlers first discovered it in the 16th century. After which it was inhabited by pirates, French, and British settlers. Originally an agricultural economy, it was used extensively to grow sugarcane. The British also used it for their Great Experiment and played a big part in shaping the population. 70% of its population has its roots in indentured laborers.
Today, Mauritius is a multicultural society with people from South Asia (mostly India), Africa, and Europe. English is most commonly spoken alongside French, Hindi, Creole, and even some Chinese languages. Hinduism, Christianity, and Islam are widely practiced. It was visited by prominent figures like Charles Darwin and Mark Twain, the latter of whom famously said that heaven itself must have been fashioned after Mauritius.
Tourism is by far the most important industry in Mauritius today. The GDP shrunk by 15% in 2020 during the pandemic. Since its independence in 1968, the economy has diversified into clothing manufacturing, information technology, and business and finance services.
Mauritius Export Overview
The history of the island’s sugarcane production is still visible today. Rum is still widely produced and sugarcane is still quite prevalent. Tourism and the colorful multi-cultural society also play a big role in the current exports. Due to foreign exposure and deep tradition, the production of clothes has also become huge.
It is also situated in the Indian Ocean making fishing another mainstay. The Trade Vision has extensive resources that inform traders of real-time trade developments in Mauritius. Exporters and importers across the world have expanded their operations using data and marketing intelligence reports from The Trade Vision.
Mauritius: Top Export Commodities
- Processed Fish ($244 million)
- Raw Sugar ($197 million)
- Non-Knit Men's Suits ($94.4 million)
- Knit T-shirts ($87.3 million)
- Non-Knit Men's Shirts ($83 million)
Mauritius: Top Export Countries
- France ($201 million)
- United States ($187 million)
- South Africa ($170 million)
- United Kingdom ($154 million)
- Zimbabwe ($148 million)
Mauritius Import Overview
Mauritius has one of the highest population densities in the world. The bustling tourism industry is loud and attractive making it a big part of the lives of local people. The same industry also demands a steady supply of high-quality food ingredients. Thus frozen fish are imported in large quantities to meet tourism demand. Since more than half the land is arable, local food requirements are met with the harvest. Having no get-rich-quick resources like crude oil, minerals, or ores though, the country has to meet its needs through imports.
Mauritius: Top Import Commodities
- Refined Petroleum ($521 million)
- Non-fillet Frozen Fish ($194 million)
- Cars ($152 million)
- Packaged Medicaments ($139 million)
- Concentrated Milk ($90.4 million)
Mauritius: Top Import Countries
- China ($781 million)
- United Arab Emirates ($510 million)
- India ($438 million)
- France ($353 million)
- South Africa ($307 million)
Mauritius: What’s In Store?
Mauritius was able to avoid the acute health crisis that COVID-19 had caused around the globe through great public management. Yet the effects of the pandemic had reversed recent gains in poverty reduction and women’s labor force participation. It had also impacted the country’s tourism industry severely, a core part of its economy. Arrivals decreased by 41.8 percent in 2021 compared to 2020. Even after the full reopening of borders on October 1, 2021, monthly arrivals hovered below 50 percent of pre-pandemic figures.
A successful vaccination campaign with 76% of the population is fully vaccinated by end-February 2022 was a cornerstone of recovery. However, as imports grew faster than exports in 2021, the trade deficit widened by 39.4%. A double-digit recession in 2020, and tourism still remain subpar.
The key challenges for the country include managing the transition to a knowledge-based economy. This is to reinvigorate growth and job creation to come back stronger than before. Even further in the future, the single biggest threat to the country seems to be climate change. Like countless other islands around the globe, Mauritius faces the urgent need to adapt to climate change or face forced migration.
Expand your business operations to Mauritius with assistance from The Trade Vision. We are an international trade research company, and we provide actionable analytics that steers clear of the noise.
Contact us now at mywishplan@thetradevision.com or call +1(307)7573116, to get started.
Download The Trade Vision Mobile App to access data on the go.
Japan: Twilight in The Land of The Rising Sun
21 Sep, 2022
0
Lying off the East Coast of Asia, the Island nation of Japan is full of contrasts and complexity. It is a land full of ancient cultural traditions where people have lived for over 30,000 years. After 1950, it rose almost overnight to become one of the largest and most developed economies of all. Today it is the most complex economy according to the Economic Complexity Index. This is due to the exports and manufacturing of sophisticated and specific machineries. The country is also home to 10% of all active volcanoes and is located at the junction of 4 tectonic plates. Natural disasters like tsunamis and earthquakes occur frequently in Japan.
Japanese people are conditioned from a young age to not create any nuisance for others. It is also the birthplace of some of the most creative modern artwork. Japanese popular culture like cuisine, anime, music, and games have taken the world by a storm. People are constantly awestruck by the novel heights of self expression that emerge from Japan.
While heavily globalized and widely capitalistic, less than 10% people are fluent in English. This contrast is perhaps the most distinguishing feature of the country.
Japan Export Overview
In 2020, Japan was the world’s biggest exporter of industrial machinery, construction vehicles, hot rolled iron, electrical capacitors, and disc chemicals for electronics. In August 2022, Japan recorded the 13th month in a row at a trade deficit. That makes it currently at a record high standing at 2.82 trillion Yen in deficit.
Despite a weaker yen as a result of stimulatory economic initiatives, export growth remains sluggish. The Trade Vision has extensive resources that inform traders of real-time trade developments in Japan. Exporters and importers across the world have expanded their operations using data and marketing intelligence reports from The Trade Vision.
Japan: Top Export Commodities
- Cars ($83.1 billion)
- Integrated Circuits ($31.3 billion)
- Motor Vehicles; Parts and Accessories ($28 billion)
- Machinery Having individual Functions ($19.9 billion)
- Photo Lab Equipment ($1.1 billion)
Japan: Top Export Countries
- China ($133 billion)
- United States ($112 billion)
- South Korea ($42.9 billion)
- Chinese Taipei ($42.7 billion)
- Hong Kong ($27.2 billion)
Japan Import Overview
Lacking local energy resources, Japan is one of the largest importers of oil and gas in the world. Until recently, it was the world’s biggest LNG importer but last year surrendered the number-one spot to China. The G7 recently agreed on a price cap for Russian oil exports. Being a member of the G7, Japan was exempt from this and continues importing oil and gas from Russia.
Imports are on the rise as high raw material prices continue and supply disruptions ease. The weaker Yen is boosting the cost of imports at a time of surging energy prices. Energy and Grain prices show signs of stabilizing but the impact of the drop in the yen is expected to continue for a while.
Japan: Top Import Commodities
- Crude Petroleum ($38.4 billion)
- Petroleum Gas ($31.4 billion)
- Integrated Circuits ($17.7 billion)
- Broadcasting Equipment ($17.5 billion)
- Computers ($14.5 billion)
Japan: Top Import Countries
- China ($151 billion)
- United States ($63.1 billion)
- Australia ($31.8 billion)
- South Korea ($25.1 billion)
- Chinese Taipei ($24.3 billion)
Japan: What’s In Store?
Japan’s international competitiveness has declined over the past few decades and its economic growth has stagnated. Japan is also facing a shrinking and aging population, which will further sap its economic vitality. In the wake of Prime Minister Shinzo Abe’s untimely demise, the country is navigating around his foreign policy.
Cost of living will continue to rise if imports rise without a change in the global economy. It will lead to the import of inflation to a country already facing a recession.
Amongst all of this, Japan is finally set to welcome unrestricted tourism from October after the pandemic. By resuming visa-free tourist travel, tourism revenue as well as foreign labor offers a ray of hope for the stagnant Economy.
Expand your business operations to Japan with assistance from The Trade Vision. We are an international trade research company, and we provide actionable analytics that steers clear of the noise.
Contact us now at mywishplan@thetradevision.com or call +1(307)7573116, to get started.
Download The Trade Vision Mobile App to access data on the go.

Russia stops gas exports to Europe: What happens now?
13 Sep, 2022
0
The onset of winter in Europe is a fascinating time. Snow on the sidewalks blankets cities and the countryside turns into a sugar-faced paradise. Smores are baked. Hot chocolates are served. Plummeting temperatures make wild animals descend from their hideouts in the mountains and provide rare sightings. But most importantly, winter is the time of Christmas, and the absolute jubilation of stockings, gifts, music, and merriment.
Although, this winter, families in Europe are bracing for what can be a calamitous period of time. Due to the war in Ukraine, members of the European Union were forced to impose sanctions on Russian businesses and oligarchs. Recently, Gazprom, the Russian state-owned gas company, has halted gas supplies to Europe citing maintenance issues. The company claims that they have found a leak in the Nord Stream 1, a pipeline that runs from Russia to Germany. Russia import and export data makes for an interesting read at this point in time.
Russia has claimed that the leak could’ve been solved speedily if Europe hadn’t placed sanctions on Russian-owned businesses. And, that the pipeline could be closed indefinitely. Global energy and policy experts claim that Russia is indulging in an arm-twisting exercise to undermine western sanctions.
The tussle has already resulted in Europe facing sky-high inflation and eroding living standards. If the standoff extends through to the winter, European families could face power cuts and a loss of heating in the coldest months of the year. Get a complete reading of oil and gas exports in this dataset by The Trade Vision.
Are sanctions even working?
Sanctions imposed by the west were initially aimed at depleting Russian foreign reserves. But poor targeting has resulted in Europe facing a cost of living crisis, while the Russian government basks in fuel revenues. The increase in global oil prices has enabled the Russian government to stave off fears of a national banking crisis.
Conversely, countries that previously exported goods to Russia and Ukraine, have tonnes of products in store, but no buyers. The Trade Vision has previously reported how Ecuadorian bananas, previously headed for Russia, are rotting on its shores. Considered in its totality, sanctions have failed to dent the Russian offensive, and a course correction might be mandated by the current pause in gas exports.
Who’s still buying Russian oil?
No other commodity in the global trade scenario is as highly-demanded as oil and natural gas. Markets tend to mimic oil rates and countries find it difficult to obtain alternative sources in times of peril. This is the case in Russia as well. It has been reported that Russia will earn more than $300 billion in energy exports this year alone. The revenues will facilitate Russia in keeping the war alive and maintaining its fiscal security. Even after Europe shifts its energy demand elsewhere, Russia will be able to sell its oil to other countries. India and China have recently started to buy more crude oil from Russia, owing to lower prices.
These are the countries that received most Russian energy exports within the first 100 days of the war.
1. China ($13.2 billion)
2. Germany ($12.7 billion)
3. Italy ($8.2 billion)
4. Netherlands ($8.2 billion)
5. Turkey ($7 billion)
What will Europe do now?
A combination of measures including demand reduction and alternative sourcing will help Europe shore up reserves before the winter. Germany is already turning to countries in the gulf and Eastern Europe to buy natural gas. Though, the real burden lies in the reduction of demand. That includes demand from households and industries alike. The economic repercussions of such reduction are yet to be measured.
The Trade Vision is an international trade research company. We provide you with actionable analytics that steers clear of the noise. Contact us now at mywishplan@thetradevision.com or call +1(307)7573116, to get started.
Download The Trade Vision Mobile App to access data on the go.

Soybean Packs a Protein Punch in Global Trade
31 Aug, 2022
0
Experts and consumers alike have long considered meat as the king of protein-rich foods. For ages, it was believed that no vegetarian substitute could match meat’s nutrient content. There was no hope for vegetarian athletes. Those living in cold regions must have meat in their diet, even if they are vegetarian by faith, or by choice.
Modern nutritional sciences have gone on to prove that a plant-based diet is extremely healthy. Healthier than diets involving meat and dairy. A plant-based diet even brings about the reversal of heart ailments. Soybean is at the center of this lifestyle movement. And, soybean import and export greatly interests agricultural traders around the world.
A common form of content on social media is the vegan blind taste challenge. Participants in the challenge are given plant-based meat substitutes that are manufactured mainly from soy. Dubbed 'the king of beans', soy is the closest to meat in terms of taste and nutrient content. Soy’s versatility and nutrient richness make it a major export product. Nearly half of all production is slated for export. Soybean oil is also widely consumed throughout the world.
What makes soybean so important
Besides being a cooking essential, a meat substitute, and a staple for millions, soybean acts as a principal source of animal feed. Consider the United States where, in 2015, 70% of the soybean was used for animal feed. It is remarkable how soybean is a meat substitute, but at the same, essential to cattle rearing. Oil produced from soybean acts as a biofuel source. In addition, several food industries use soybean as a raw material.
Soybean import-export data
The crop has its history rooted in the east. Korea, Japan, and China have recorded their use for centuries past. But in the modern trade scenario, countries in the Americas account for most of the production. Find a detailed soybean import-export trade database at The Trade Vision. Access real-time data from across countries and hundreds of commodities on The Trade Vision mobile app.
Soybean’s total export value was recorded at $64 billion in 2020. Following are the top soybean exporting and importing countries.
Top Soybean exporting countries
1. Brazil ($28.6 billion)
2. United States ($25.6 billion)
3. Argentina ($2.31 billion)
4. Paraguay ($2.15 billion)
5. Canada ($1.95 billion)
Top Soybean importing countries
1. China ($37.4 billion)
2. Netherlands ($2.44 billion)
3. Mexico ($2.19 billion)
4. Egypt ($1.82 billion)
5. Argentina ($1.76 billion)
What the future holds for soybean
The emergence of soybean as a biofuel has a sinister bearing. As biofuel becomes more common, the rise in demand will cause a spike in prices. For people in poorer countries, this spike in prices could release an avalanche of food insecurity troubles.
To increase soybean production, farmers shifting to the crop will need to clear land. In countries such as Brazil and Argentina, this deforestation will be devastating. The Amazon rainforest covers these countries and acts as the ‘lungs of the world.’ Already, cattle rearing and soybean production in Brazil are contentious issues. Environmentalists are often at loggerheads with agribusiness owners and farmers. The government must seek international cooperation and find the middle ground between conservation and profits. Brazil’s presidential elections in 2022 will play a key role in the future of soybean production.

Mining the future in Zambia
26 Aug, 2022
0
Situated in East Africa, Zambia is an exquisite land shaded in copper hues. Along the Congolese Border, extravagantly-sized Zambian copper mines fuel the nation’s development. International investors, previously deterred by volatile governments, are flocking to the nation in a bid to boost copper production. Zambia is already the world’s largest exporter of copper. As the world moves towards renewable energy, Zambia’s vast copper and cobalt reserves will further improve economic conditions.
Zambia has registered a steady GDP growth since the turn of the century. The growth rates have averaged 6%. Post-COVID economic recovery has been aided by higher copper rates, better agricultural output, and a return of investor confidence. Culturally rich Zambia is a place where people truly believe in mutual respect and peaceful coexistence. The values of a close-knit family have survived the pangs of globalization.
The population, steadily growing at close to 3% annually, will soon demand more jobs and greater social security. The increasing presence of global mining companies is a positive sign to that end. The investments shall hopefully deliver the developmental progress that the people need and deserve.
Zambia export overview
Recently, China promised to reconstruct the Tazara Railway line between Zambia and Tanzania. Being landlocked, Zambia’s primary access to seaports is through South Africa, Tanzania, and Namibia. Redevelopment of the Tazara railway line, initially constructed during the days of Mao Zedong, will boost Zambian exports’ competitiveness. The project is China’s biggest foreign aid injection in Africa.
Zambia has two of the twenty largest copper mines in the world. The country was the largest exporter of raw copper in 2020. The Trade Vision has extensive resources that inform traders of real-time trade developments in Zambia. Exporters and importers across the world have expanded their operations using data and marketing intelligence reports from The Trade Vision.
Zambia: Top export commodities
1. Raw Copper ($5.77 billion)
2. Refined Copper ($2.03 billion)
3. Gold ($757 million)
4. Copper Ore ($195 million)
5. Raw Tobacco ($185 million)
Zambia: Top export countries
1. Switzerland ($3.46 billion)
2. China ($1.53 billion)
3. Namibia ($1.35 billion)
4. Democratic Republic of the Congo ($952 million)
5. Singapore ($913 million)
Zambia import overview
The growing Zambian population is increasingly centered around urban areas. Yet the Zambian economy is heavily dependent on subsistence farming. Unemployment is high. Poverty levels hover around 60%. Last year, the decent agricultural output was of little help in alleviating hunger. Aid agencies work actively with local organizations to supply desperate Zambians with food.
The world hopes that incomes from Zambia’s extensive copper reserves trickle down to the people. The increase in income will lead to better consumption, which in turn will boost the nation’s economic prospects. Zambia’s imports speak of the country’s developmental nature. Most resources are invested in improving basic infrastructure.
Zambia: Top import commodities
1. Refined Copper ($290 million)
2. Refined Petroleum ($216 million)
3. Crude Petroleum ($205 million)
4. Nitrogenous Fertilizers ($170 million)
5. Mixed Mineral or Chemical Fertilizers ($153 million)
Zambia: Top import countries
1. South Africa ($1.77 billion)
2. China ($916 million)
3. United Arab Emirates ($505 million)
4. Democratic Republic of the Congo ($372 million)
5. India ($303 million)
Zambia: What’s in store?
The government of President Hakainde Hichilema has brought back investor confidence by signing debt relief deals with China. This development has helped clear the way for a $1.4 billion relief package by the IMF. But before Zambia can become a truly global economy, the country must address its domestic economic issues. Overdependence on the public sector has resulted in a constricted bureaucratic system. This has further given rise to red-tapism and administrative hurdles.
The Hichilema government came to power on a thumping majority. They can use the opportunity to build the Zambian economy from the ground up. Besides, unlike elsewhere in Africa, Zambia must look to spread the incoming revenue among the people, and not limit it to a few hands at the top of society.
Expand your business operations to Zambia with assistance from The Trade Vision. We are an international trade research company, and we provide actionable analytics that steers clear of the noise.
Contact us now at mywishplan@thetradevision.com or call +1(307)7573116, to get started.
Download The Trade Vision Mobile App to access data on the go.

Ethiopia: A lion awaits redemption
23 Aug, 2022
0
Stagnation stumps Ethiopia after the nation was one of the fastest growing global economies for a decade and a half. The COVID19 pandemic was bad enough to disrupt livelihoods and give rise to macro-level problems. But the raging civil war between the ruling party and the Tigrayan People’s Liberation Front (TPLF), has far elevated the troubles.
Tigray is a region in the north of the country where civil war broke out in late 2020. Since then, there have been multiple reports of civilian casualties, rape, and crimes against humanity. Chilling accounts of suffering emanate every day from the region. The latest among these is the Ethiopian army laying siege around Tigray, and stopping humanitarian aid.
In another interesting development, grain supplies recently departed Ukrainian shores to reach Ethiopia’s starving population. Russia and Ukraine had recently signed a pact to let grains’ shipments pass unharmed.
Ethiopia’s sinking economy
The economy has also suffered immensely. The passing of a country from peace to a wartime situation entails higher security and humanitarian costs. Ethiopia is no different. Add to this the burgeoning cost of redevelopment. Ethiopia has the second-largest population in Africa, with most about to graduate into the working class.
The country, with an expected rise in disposable incomes, should be at the top of the list for foreign investors. However, with the deterrence of corruption, and a weak currency, is now the added fear of war. International investment is unlikely to flow into the nation as per desired goals.
Ethiopia export analysis
The proposed reforms of 2019 have been overshadowed by the civil war. Ethiopia’s credit ratings are in a freefall. Yet, investments from before the civil war continue to give investors hope. Indian, Chinese, Emirati, and American business interests lay in the area. If you are a trader wishing to learn more about Ethiopia’s exports, don’t forget to access this free version of Ethiopia export data. The Trade Vision compiles these datasets, and more elaborate market intelligence reports to give your business the global edge.
The total exports in 2020 were valued at $3.5 billion.
Top Export Commodities
1. Coffee ($860 million)
2. Other Oily Seeds ($384 million)
3. Gas Turbines ($328 million)
4. Other Vegetables ($261 million)
5. Gold ($194 million)
Top Export Countries
1. United States ($409 million)
2. Somalia ($294 million)
3. Hong Kong ($253 million)
4. United Arab Emirates ($247 million)
5. Saudi Arabia ($203 million)
Ethiopia Import Analysis
Being a populous country lends Ethiopia the advantage of being a large domestic market. Businesses from around the world look on as the economic opportunities are squandered by the government in power. But experts estimate that by 2023, the nation would be back on the recovery path. The total imports in 2020 were valued at $11.1 billion.
If you are looking to enter the Ethiopian market, The Trade Vision provides the most accurate and dynamic market intelligence reports. Gear up for the Ethiopian recovery, and plan your expansion with the aid of reliable data.
Top Import Commodities
1. Refined Petroleum ($1.24 billion)
2. Gas Turbines ($532 million)
3. Planes, Helicopters, and/or Spacecraft ($406 million)
4. Wheat ($320 million)
5. Packaged Medicaments ($317 million)
Top Import Countries
1. China ($2.75 billion)
2. India ($903 million)
3. United Arab Emirates ($798 million)
4. United States ($554 million)
5. Kuwait ($530 million)
Expand your business operations to Ethiopia with assistance from The Trade Vision. We are an international trade research company and we provide actionable analytics that steers clear of the noise.
Contact us now at mywishplan@thetradevision.com or call +1(307)7573116, to get started.
Download The Trade Vision Mobile App to access data on the go.

The Philippines’ Economic Outlook: 2022
9 Aug, 2022
0
The scenic archipelagic islands of the Philippines have a strange relationship with the country’s economic cohesiveness. This pertains to how the two display a near-perfect contrast. On one hand, the islands are places of immense beauty yet broken, fragmentary landmasses where sustenance is a constant challenge. A third of the population works in agriculture but the sector contributes to only about 14% of the GDP.
While the economy, imposing in its size and growing speedily at 6.4% in the previous decade, promises hope but delivers staggering income inequality and poverty. Despite having a strong post-COVID recovery, the Philippines struggles behind other ASEAN members in poverty levels.
What the Philippines did right
The Philippine government must be credited for developing extensive infrastructure, and inviting foreign investment with trade-friendly policies. The Philippine literacy rate is amongst the highest in the region. Remittances from abroad have also shored up foreign exchange. All these factors provide a strong domestic market, and increased demand for consumer products. The opportunity to make the most of this emerging economy presents itself to importers and exporters around the world.
Begin your Asian expansion with these essential import-export dynamics governing the trade of the Philippines.
Philippines Export Analysis
The Trade Vision provides the most accurate and latest export data from the Philippines. Our market intelligence reports have helped hundreds of traders find reliable statistics, and buyers and suppliers from unknown lands. It is imperative for you to analyze this information as The Philippines is one of the fastest growing economies in South-east Asia. The Philippines exported a total of $79.5 billion in 2020. The nation is the world’s largest exporter of Nickel Ore($1.34 billion).
The rapidly expanding service sector promises to fill the economy with jobs. The nation stands to become an upper middle income country in the coming years.
Top Export Commodities
1. Integrated Circuits ($22.6 billion)
2. Office Machine Parts ($9.32 billion)
3. Electrical Transformers ($2.36 billion)
4. Insulated Wire ($2.32 billion)
5. Semiconductor Devices ($2.18 billion)
Top Export Countries
1. China ($12.9 billion)
2. United States ($10.7 billion)
3. Japan ($10.3 billion)
4. Hong Kong ($10 billion)
5. Singapore ($6.28 billion)
The Philippines Import Analysis
As infrastructural development reaches towns and cities, the Philippines is set to become a major consumer market. Traders looking to sell their products in the nation must contact The Trade Vision for an extensive list of port data, competitors’ shipment size, frequency, domestic demand, and other statistics.
The Philippines’ imports speak of its industrial activity. A lot of electronic equipment arrives in the Philippines for assembly, and further dispatch. There is a rising demand for consumer electronics, and cars. Tourism also contributes to local industry and development.
Top Import Commodities
1. Integrated Circuits ($12.3 billion)
2. Refined Petroleum ($5.61 billion)
3. Broadcasting Equipment ($2.89 billion)
4. Office Machine Parts ($2.45 billion)
5. Cars ($2.16 billion)
Top Import Countries
1. China ($34.5 billion)
2. Japan ($8.21 billion)
3. South Korea($7.31 billion)
4. United States ($6.84 billion)
5. Indonesia ($6.34 billion)
What the future looks like
The recent election of Bongbong Marcos Jr. as President of the Philippines will result in continuation of the Duterte-era policies. Infrastructural development will resume at the pace of the past years.
The election has been marred by misinformation campaigns and strongman tactics pointed out by local and international media. Rodrigo Duterte’s likening for authoritarianism might get a new life in Marcos’ presidency. But any indication of the subjugation of democratic values will not bode well with international investors. After the recent economic shocks and ensuing troubles, the Philippines needs a leader who serves the nation and no one else. Anything other than that would be an indelible blot on the exceptional perseverance of the Philippine population.

Expand Your Import Export Operations to Paraguay
1 Aug, 2022
0
Paraguay in South America is geographically squeezed between larger neighbors such as Brazil and Argentina. Without access to much capital investment or a major seaport, Paraguay turned to its natural gifts to make the most of its economic situation. Blessed with a wide network of rivers, Paraguay’s inland ports handle almost all of its soy exports. Being fertile, owing to the rivers again, Paraguay is a leading exporter of soy and other agricultural products.
Paraguay produces most of its energy using, unsurprisingly, its rivers. The nation leads global per capita clean energy production as close to 99% of its power comes from hydroelectricity. 90% of this energy is exported to neighboring Argentina and Brazil. Paraguay is the fifth-largest exporter of energy in the world and the second largest net exporter.
Rio Paraguai, Paraná, and Pilcomayo are Paraguay’s major rivers.
Paraguay Export Analysis
Besides hydroelectricity and soy, Paraguay is one of the top exporters of organic sugar, and also has a strong cement-producing sector. Reach out to The Trade Vision for a detailed analysis of Paraguay’s export numbers, trends, and emerging market opportunities. We have helped thousands of businesses expand their operations to new lands with our market intelligence reports.
Its over-dependence on agriculture has made Paraguay one of the poorest countries in South America. Furthermore, stagnated industrial development has kept wealth limited in the hands of a few individuals. The government must look to secure foreign investment to boost its economy. More investment must be made in the textile sector, where tax breaks and other benefits are already in place.
Top Export Commodities
1. Soya beans ($2.15 billion)
2. Electricity ($1.73 billion)
3. Oil-cake ($684 million)
4. Meat of bovine animals; frozen ($592 million)
5. Meat of bovine animals; fresh or chilled ($527 million)
Top Export Countries
1. Brazil ($3.02 billion)
2. Argentina ($2.13 billion)
3. Chile ($773 million)
4. Russia ($487 million)
5. United States ($180 million)
Paraguay Import Analysis
Consisting of swamplands, waterfalls, national parks, and more, Paraguay is a land of impeccable natural beauty. Therefore, tourism plays a big role in the nation’s economy. Most imports to the country are meant for building or shoring up basic services such as communications, transportation, and infrastructural development.
You can track imports arriving in Paraguay with real-time data and reports from The Trade Vision. Access this free version of Paraguay Import Data.
Top Import Commodities
1. Transmission apparatus ($1.41 billion)
2. Petroleum oils ($967 million)
3. Motor cars ($352 million)
4. Insecticides ($343 million)
5. Fertilizers ($195 million)
Top Import Countries
1. China ($2.81 billion)
2. Brazil ($2.19 billion)
3. United States ($1.04 billion)
4. Argentina ($875 million)
5. Chile ($367 million)
Paraguay: What the future holds
Through structural reforms, low external debt, and stable inflation, the government has kept the nation of Paraguay stable in the past years. But the pandemic pushed back the poverty reduction efforts. With a drought this year and high inflation due to global fuel and food prices, 2024 looks likely to be the year when Paraguay returns to pre-pandemic poverty levels.
Economic opportunities in Paraguay will excite investors looking to enter a trade-friendly economy that can deliver high growth in the future. Expand your business operations to Paraguay with assistance from The Trade Vision.
Contact us now at mywishplan@thetradevision.com or call +1(307)7573116, to get started.
Download The Trade Vision Mobile App to access data on the go.

7-Point Import Export Trade Data ChecklistBegin your international trade journey with this 7-point import export trade data checklist.
19 Jul, 2022
0
Few professions are as underrated as that of an import-export trader. Selling products overseas successfully requires research, analysis, experience, risk-readiness, and quick decision-making. Import export data by reputed providers helps with the research and analysis bit. But only a deep understanding of the multifarious factors affecting import-export trade can inform you of the true reality. Let alone the geopolitical tugging and economic lugging, a trader also has to deal with local and international legal frameworks.
When that is worked out, a trader must be aware of competitors' shipment volumes, and global trends to pick the most opportune moment to send their shipment. They must also search for trusted suppliers or buyers in foreign countries, often without local resources or contacts.
This is where The Trade Vision comes to your rescue. Our expertly churned market intelligence reports help you understand elusive trade dynamics. The data we provide has enabled thousands to expand their businesses by finding international resources at the click of a button.
Begin your international trade journey with this 7-point import export trade data checklist.
1. Shipment Details
With import export data, you learn important details like shipment size, quantity, location, and frequency. You also come to know of the product specifications, the port it originated from, and the port that it is headed to. Use this data to make informed choices about your own product and inventory flows.
2. Competitor Analysis
Analyzing the competition is a crucial part of import-export trade. While making important business decisions, you need to stay abreast of competitor developments to tune your shipments to the call of the market. With competitors’ data, you can solve inventory issues and make shipping improvements.
3. Port Data
Obtained from government and shipping companies’ declarations, port data helps you understand the volume and type of shipments arriving in a country. In some cases, port data also tells the details of regional demand and expected revenue.
4. New Opportunities
Import-export data and market intelligence reports are essential for traders looking to expand their operations. You must obtain a fair picture of the opportunities in another country or continent before entering that market. Economic information, such as increased consumer demand or reduced supply, makes it easier for you to tap into the opportunities.
5. Global Trends
A trends analysis throws light upon the geopolitical factors that help or hinder your business. In the age of globalization, trade between countries is affected immensely by war, conflicts, climate change, and economic upheavals.
6. Trade Resources
Important trade resources are a complete run-down of foreign suppliers/buyers' data. It includes basic contact information, the volume of trade, preferred products, and shipping details. A data provider only gives vetted information to avoid unfortunate instances of mischief or fraud.
7. Current and Future Threats
Operating in a global business environment opens up traders to threats from several factors. Primarily, the legal and policy frameworks of a particular country. You must prepare for arising threats when governments decide to promote or hinder the production of products.
With market intelligence reports, you can stay on top of each and every new development.
Innovation Makes Everything Easier
Thanks to modern data analytics and artificial intelligence, you can find all this information in one place.
The Trade Vision is one of the finest international trade research companies. We provide you with actionable analytics that steers clear of the noise. Contact us now at mywishplan@thetradevision.com or call +1(307)7573116, to get started.
Download The Trade Vision Mobile App to access data on the go.

4 Reasons Why Global Trade Data is Essential For Your Survival
15 Jul, 2022
0
In the never-ending hum of statistics, data, geopolitics, and development, we often overlook the sheer wonder of international trade. We miss how products conceptualized in one place, are manufactured someplace else. They are then shipped globally, and finally bought almost unthinkingly by the ordinary consumer. Why is this journey so overlooked by us? Why are statistics more important than trends or ideas, or mere observations?
These are four reasons why global trade data is essential for your survival as a trader and as an individual.
1. International Trade Is A Business Whirlwind in the 21st Century
Perhaps our obsession with numbers can be explained by the fact that international trade has never been as sophisticated. The intricacies and power dynamics displayed by global trade are unprecedented and invoke great curiosity in academic and trade circles.
Take, for instance, China’s Belt and Road Initiative(BRI). It a multi-trillion dollar project that cuts through continents, breaking development barriers yet giving rise to greater challenges like corruption and climate change. Western countries see it as a massive soft power exercise where debt and interest payments lend influence and strategic dominance to China.
Consider the war between Ukraine and Russia, and how the conflict has affected fuel prices and food security worldwide. Most notably in Sri Lanka, where disturbingly long queues snake outside petrol stations and people struggle to get one square meal.
Think also of the rising economies of Asia. How countries like Bangladesh and Vietnam have leveraged their workforce to build robust economies from dire straits.
2. Global Trade Data Detangles Difficult Trade Dynamics
We need numbers and data to better our understanding of global trade in a timely and easy manner. The understanding of global trade data is more pertinent than ever. That is why you need a reputed partner like The Trade Vision. We help you break down the factors that affect your business and push you in the right directions.
Our expertly crafted market intelligence reports help you understand the product flows of countries and how you can enter new markets. For when you understand, you make choices from a position of knowing. Your knowledge translates into decision-making, and decisions translate into profits.
3. Why You Need Trade Data Now More than Ever
The more bewildering trade dynamics become, the more we need data to understand the factors affecting the exchange of goods between countries. It is in the everlasting quality of mathematics and data science that reduces complexity to convenience and chaos to order.
For instance, let’s say you are an electronics manufacturer looking to offshore production. Without global trade data, it will be impossible for you to determine which country you should shift your operations to. Going by trends alone, you will be inclined to go to India or perhaps China. But with global trade data, you will realize that there is real value to be obtained from South East Asian countries like Vietnam and Thailand.
4. Rhetoric Doesn’t Always Make Sense; Data Does
Many a politician has made claims about the robustness of an economy, only to be outdone by the power of data. Leaders are experts at rhetoric but not at data science. People in a democracy are often fed data that is outdated, out of context, or downright false. Media outlets looking to grab the all-important eyeballs magnify the false information and give it a life of its own. Nowadays, this misinformation is further sustained by social media, and at a frenzied pitch.
This is why trusted data providers like The Trade Vision rely on much more than government declarations to formulate their reports. Our experts crunch ceaseless piles of port data, companies declarations, and local sources to give you the truth, every time.
The Trade Vision is an international trade research company. We provide you with actionable analytics that steers clear of the noise. Contact us now at mywishplan@thetradevision.com or call +1(307)7573116, to get started.
Download The Trade Vision Mobile App to access data on the go.
Vietnam Global Trade Analysis and Market Report
11 Jul, 2022
0
Its economics and society torn apart by war, Vietnam used to be a poor, struggling nation in the 1970s. There was widespread chaos, destruction, and civil strife. However, since the Đổi Mới reforms of 1986, Vietnam has become one of the finest development stories in the history of nations.
Vietnam’s import-export data suggests that the country is a leading supplier of phones, computers, machinery, textiles, and footwear. The export-led economic policy has helped keep growth rates stable even during the pandemic. Estimates suggest that Vietnam is slated to become a high-income nation by 2045. This will be accompanied by carbon neutrality, to be attained by 2050.
Vietnam has come to be a premier choice for essential industries like electronics and textiles. Businesses from around the world are proactively working towards a beyond Chinese strategy. In Vietnam, not only are the labor costs lower but the geopolitical neutrality and proximity to major markets in South East Asia, all make the country stand a peg above China.
Samsung, one of the world’s leading smartphone manufacturers, gets almost a third of its products made in Vietnam. The company has invested enormously in the nation’s markets and is also developing domestic peripheral industries.
Vietnam Export Analysis
Vietnam’s leaders have built the nation on robust economic foundations. Transparency, ease of doing business, free trade agreements, and an export-oriented growth model have helped Vietnam become an economic giant.
The Trade Vision has astutely compiled the latest of Vietnam’s import-export data. Our excellent market intelligence reports draw on ages of learning and on-ground research to outline the opportunities for traders around the world. Access this free version of Vietnam Export Data.
Besides electronics and textiles, Vietnam is also a leading producer of Coffee. Behind only Brazil in its export output, Vietnam’s coffee export was valued at $3.1 billion, in 2021. About 90% of Vietnam’s coffee production is sent to global markets. Rice is another top agricultural export.
Top Export Commodities
1. Transmission apparatus for radio-broadcasting or television ($42 billion)
2. Telephone sets ($21.4 billion)
3. Electronic integrated circuits ($19.4 billion)
4. Footwear ($8.9 billion)
5. Machinery; parts and accessories ($7.68 billion)
Top Export Destinations
1. United States ($77 billion)
2. China ($49.4 billion)
3. Japan ($20.4 billion)
4. South Korea ($19.6 billion)
5. Hong Kong ($13.8 billion)
Vietnam Import Analysis
With a growing economy comes a growing middle-class population. And with a growing middle-class population comes a growing consumer economy. In Vietnam, that is just the case. Rising incomes have propelled domestic industries such as pharmaceuticals, e-commerce, and automotive into becoming supremely pertinent.
The nation is subject to various FTAs that allow for easy set up of industries for foreign companies. Vietnam also displays a growing appetite for imports of raw materials as more industries are springing up every day. Harness the best of the nation’s opportunities with Vietnam’s global trade data presented by The Trade Vision. Our experts have produced several reports and datasets that will help you understand domestic trade flows, competitors’ shipment dynamics, and more. Access this free version of Vietnam Import Data.
Top Import Commodities
1. Electronic integrated circuits ($34.2 billion)
2. Telephone sets ($16.5 billion)
3. Diodes, transistors, and similar semiconductor devices ($6.04 billion)
4. Fabrics; knitted or crocheted ($4.84 billion)
5. Transmission apparatus ($4.1 billion)
Top Importing Countries
1. China ($104 billion)
2. South Korea ($48 billion)
3. Japan ($16.1 billion)
4. Chinese Taipei ($11.5 billion)
5. Thailand ($11.2 billion)
Vietnam: The growth continues
As China becomes more and more expensive for foreign companies, Vietnam is expected to receive business that falls out of favor with the dragon. 25% of Vietnam’s GDP in 2021 was attributed to the manufacturing sector. Low-cost production has allowed the nation to emerge as a regional leader in the manufacturing sector. The incentives and low tax rates are helpful to foreign businesses. What’s more encouraging is that the growing domestic consumer market is better than just a cherry on top, for it is the cake itself.
The Trade Vision is an international trade research company. We provide you with actionable analytics that steers clear of the noise. Contact us now at mywishplan@thetradevision.com or call +1(307)7573116, to get started.
Download The Trade Vision Mobile App to access data on the go.

Pakistan Import Export Data and Analysis
27 Jun, 2022
0
The political seasons of Pakistan determine its economic stability. Pakistan's import-export statistics only make for a fair reading when considered in the backdrop of Pakistan’s politics. There can be no denying that Pakistan has been poorly let down by its leaders. Since its inception, no Pakistani Prime Minister has served a full five-year term. This has left the nation perpetually teetering on the brink of a political crisis. Policy changes have not been seen through execution; legislators worry more about their position than their responsibilities; foreign businesses are wary of setting up operations in Pakistan due to the political volatility.
In the past few weeks, another Prime Minister, Imran Khan, was ousted; giving rise to political turmoil; then another short-term government was elected. It, therefore, comes as no surprise that Pakistan is suffering from a deepening economic crisis. Interest rates are skyrocketing. There are signs of hyperinflation as inflation rates topped 13% in April 2022. Pakistan’s import bill ($45.82 billion) was almost double the export numbers ($26.34 billion), in 2020 as per the World Bank.
Pakistan Export Analysis
Pakistan has a bustling textile industry. The sector contributes to about 60% of the nation’s exports. The United States is a significant buyer of Pakistani textiles, the leading commodities being house linens and knit sweaters. The Trade Vision has compiled an extensive database of Pakistan’s export data that American textile importers can leverage to trade within the country. Our experts have churned tons of information, government declarations, and local sources to bring you the latest, most accurate information.
Pakistan has a positive demographic dividend that can usher its economy to success. With the government’s endeavors and the IMF’s assistance, the economy can reach its true potential within a matter of years. A good start would be to give a push to the apparel industry, along the lines of Bangladesh’s recent RMG sector boom.
Pakistan’s Top Export Commodities
1. House Linens ($3.61 billion)
2. Rice ($2.14 billion)
3. Non-Knit Men's Suits ($1.8 billion)
4. Non-Knit Women's Suits ($1.06 billion)
5. Knit Sweaters ($950 million)
Pakistan’s Top Export Countries
1. United States ($4.04 billion)
2. Germany ($2.13 billion)
3. China ($1.97 billion)
4. United Kingdom ($1.73 billion)
5. United Arab Emirates ($1.09 billion)
Pakistan Import Analysis
Recently, Pakistan was in the news for a minister requesting the people to drink less tea. The beverage is a favorite among the people and local production is not nearly enough to fulfill the demand. Pakistan is the world’s highest importer of tea, and most of it comes from Kenya. The Trade Vision is one of the foremost market intelligence firms that provide Pakistan’s trade data and in-depth research on the country’s prospects for your business. For over 15 years, our clients have lauded us for providing the most accurate and widely researched reports. Begin exporting to Pakistan with access to the free version of Pakistan’s import data.
China has formed a special defense and economic relationship with Pakistan. China has pumped billions of dollars into infrastructure projects in Pakistan. China is also developing and gaining access to the Gwadar port in South Pakistan, through the China-Pakistan Economic Corridor. The relationship is a sore point for American interests. Although, through the initiative, China has gained a ready market for its electronics exports.
Pakistan’s Top Import Commodities
1. Refined Petroleum ($3.87 billion)
2. Petroleum Gas ($2.24 billion)
3. Palm Oil ($2.15 billion)
4. Crude Petroleum ($1.92 billion)
5. Raw Cotton ($1.68 billion)
Pakistan’s Top Import Countries
1. China ($14.7 billion)
2. United Arab Emirates ($5.34 billion)
3. United States ($2.78 billion)
4. Indonesia ($2.43 billion)
5. Saudi Arabia ($1.8 billion)
The Future of Pakistan’s Import Export
Few industries in the nation are as high-potential as Pakistan’s textile industry. The sector already employs about 40% of the labor force. The numbers could increase significantly if given the proper governmental assistance. But first, the polity of Pakistan needs to wrench its nation out of the economic troubles it is embroiled in. Reaching a deal with the International Monetary Fund will only do so much. Pakistan needs a reimagining of its economy and its democracy. The foreign reserve deficit needs a reversal to make it viable for foreign businesses to enter Pakistan. It is disheartening for the global import export community that these economic changes in Pakistan might yet be a little further down the line than would be imagined.
The Trade Vision is an international trade research company. We provide you with actionable analytics that steers clear of the noise. Contact us now at mywishplan@thetradevision.com or call +1(307)7573116, to get started.
Download The Trade Vision Mobile App to access data on the go.

Bangladesh Import-Export Data and Analysis
20 Jun, 2022
0
In recent years, Bangladesh’s economy has become synonymous with its bustling ready-made garments (RMG) industry. The study of Bangladesh’s import export data starts with the RMG manufacturing industry. From comprising just 3% of Bangladesh’s exports in the 1980s, the sector now contributes to about 80% of the nation’s exports. Bangladesh’s emergence came at a time when apparel companies sought alternatives to the Chinese apparel industry that had a case of over-dependence.
Bangladesh has proven to be an exemplary substitute. Top fashion companies from around the world have rushed into Bangladesh. They have harnessed the nation’s large workforce, low wages, and export-friendly policies. In turn, Bangladesh achieved the highest combined economic growth from 2010 to 2020 among all other nations.
Its government and non-government organizations have been hailed for their work in poverty reduction. The increase in income, giving rise to imports, has also helped the consumer economy to flourish. The future holds more exciting things for the economy. Bangladesh stands to become a developed country less than two decades from now.
Bangladesh Export Data and Analysis
The Trade Vision has compiled an extensive bank of Bangladesh’s export data. Your business can only thrive with access to critical information such as the size, FOB value, and frequency of competitors' shipments. Our extensive market intelligence reports give you a clear picture of the trading scenario in Bangladesh. These reports can help you move your manufacturing operations to Bangladesh without worry.
As mentioned before, four-fifths of Bangladesh’s exports come from the RMG sector. It is also the world’s leading exporter of items such as non-knit men’s shirts and jute yarn.
Leading Export Countries
1. Germany ($6.59 billion)
2. United States ($6.25 billion)
3. United Kingdom ($3.05 billion)
4. Spain ($2.95 billion)
5. Poland ($2.27 billion)
Top Export Commodities
1. Non-Knit Men's Suits ($5.75 billion)
2. Knit T-shirts ($5.74 billion)
3. Knit Sweaters ($4.91 billion)
4. Non-Knit Women's Suits ($4.63 billion)
5. Knit Women's Suits ($2.45 billion)
Bangladesh Import Data and Analysis
Bangladesh has a great demographic dividend. The consumer industry is bound to grow further in the future as more young people join the workforce. While the consumer economy booms, exporters around the world must look to enhance their presence in Bangladesh. Currently, Bangladesh’s top imports are various raw materials for the garments manufacturing industry.
Agriculture-wise, the nation has significant land under cultivation and a decent output. But regular floods hurt Bangladesh’s grains stockpile year after year. There is, therefore, an opportunity for wheat exporters to send their produce to Bangladesh. The Trade Vision gives you a deep analysis of import movements on Bangladesh’s shores. Attain a comprehensive understanding of the country’s import technicalities. Access this free version of Bangladesh’s import data.
Leading Import Countries
1. China ($15 billion)
2. India ($7.91 billion)
3. Singapore ($2.29 billion)
4. United States ($1.79 billion)
5. Indonesia ($1.69 billion)
Top Import Commodities
1. Refined Petroleum ($2.64 billion)
2. Raw Cotton ($1.8 billion)
3. Wheat ($1.28 billion)
4. Light Rubberized Knitted Fabric ($1.09 billion)
5. Heavy Pure Woven Cotton ($975 million)
Bangladesh: The Economic Future
In an exemplary show of developmental resilience, Bangladesh has uplifted its economy from dire straits to exceptional success within a span of a few decades. The residents enjoy a standard of living that is better than most of its neighboring countries. Bangladesh ranks highly on the Human Development Index. Once the government regularises the factories and unclogs the pressure on its cities, Bangladesh will achieve further growth that shall be endless and equitable.
The Trade Vision is an international trade research company. We provide you with actionable analytics that steers clear of the noise. Contact us now at mywishplan@thetradevision.com or call +1(307)7573116, to get started.
Download The Trade Vision Mobile App to access data on the go.

China Import Export Data and Analysis
15 Jun, 2022
0
Geopolitics aside, China stands as a true model of economic growth among the modern superpowers. Compare any other country or region of the world, and China always comes out on top. This extends from its manufacturing industry, without an equal anywhere, or its exemplary import-export numbers. China, though at political odds with the United States of America, has constantly exceeded expectations and is described as a premier model of economic growth. From a GDP of a little under $150 billion in 1978, China has now become a nation with a GDP of $14.72 trillion, averaging 10% growth rate for 30 consecutive years. The nation has achieved the most economies of scale, the highest per capita output, and governmental action to make rapid industrial growth possible.
China’s economy is built upon its export largesse. It is said that about one in three of the world’s consumer products is manufactured in China. Rightfully, the nation is referred to as the manufacturing hub of the world. But the economy's import-export prowess hasn’t come without a cost. The Chinese Communist government has been accused of loan sharking, promoting military standoffs and propagating human rights violations. Recent stringent lockdowns have presented a further challenge. However, China’s rapid growth is a model for all developing and least developed nations to follow. Create jobs. Give tax breaks. Promote industry, social services and foreign investment.
China Export Analysis
China has seamlessly become the manufacturer of almost every consumer product available around the world. From humble beginnings, China has become a superpower and affects almost every trader, businessperson and consumer in the world. Reach out to the Trade Vision to understand the true trade dynamics of China’s import export data, economic activity, and market intelligence reports. With vast import export data centres spread all over China, The Trade Vision brings you the latest China Export Data at the tips of your fingers. The primary focus is to understand the new trends. Your business thrives when you know the latest happenings before anyone else.
The Chinese economy presents the best opportunity to IT and tech players. Even though Covid-related disruptions have caused major players to diversify production to other South-East Asian countries, China still remains the most reliable supplier of semi-conductors.
China’s Leading Export Countries
1. United States ($438 billion)
2. Hong Kong ($262 billion)
3. Japan ($151 billion)
4. Germany ($112 billion)
5. South Korea ($110 billion)
China’s Primary Export Commodities
1. Broadcasting Equipment ($223 billion)
2. Computers ($156 billion)
3. Integrated Circuits ($120 billion)
4. Office Machine Parts ($86.8 billion)
5. Cloth Articles ($60.7 billion)
China Import Data
When the export economy booms, the consumer economy rises too. As income has steadily risen in the nation of China, so has the proliferation of consumer-friendly goods and services, This is why establishments catering to the young, online marketplaces and medical industries are the fastest growing in China. Foreign real estate firms are also constantly looking to make the most of the Chinese development story. The Trade Vision is your one-stop solution to sell your products in China. Gain access to this free version of China’s Import Data.
China’s Leading Import Countries
1. Japan ($133 billion)
2. South Korea ($131 billion)
3. United States ($122 billion)
4. Germany ($106 billion)
5. Chinese Taipei ($104 billion)
China’s Primary Import Commodities-
1. Crude Petroleum ($150 billion)
2. Integrated Circuits ($144 billion)
3. Iron Ore ($99 billion)
4. Cars ($42 billion)
5. Soybeans ($37.4 billion)
The Trade Vision is an international trade research company. We provide you with actionable analytics that steers clear of the noise. Contact us now at mywishplan@thetradevision.com or call +1(307)7573116, to get started.
Download The Trade Vision Mobile App to access data on the go.

Brunei Import Export Data and Analysis
10 Jun, 2022
0
The region of South East Asia is as diverse as it is culturally complex. Centuries of colonial rule combined with deep-rooted local cultures present a wondrous land for all to explore. Brunei is a nation that perfectly exemplifies the distinctness of South East Asia.
Brunei was under British rule until 1984. Since then, the discovery of oil reserves has catapulted Brunei’s economy into being one of the highest per capita income nations in Asia. Brunei’s import-export operations are centred around the capital city of Bandar Seri Begawan. The nation is a part of the Commonwealth of Nations and ASEAN. Malaysia is the only country that shares a border with Brunei.
Brunei Exports Oil; Imports About Everything Else
Hydrocarbon resources (oil, petroleum and natural gas) exports account for about half of Brunei’s income. The government has induced policy changes to diversify the economy. An unhealthy dependence on one commodity makes Brunei vulnerable to fluctuations in global oil prices. But Brunei is not the most agriculturally well endowed. Most of Brunei’s land is infertile and unfit for agriculture. However, government programs have targeted the improvement of agricultural production. Earlier, Brunei was wholly reliant on imports of fish, dairy, rice and vegetables. Now, it is nearly self-sufficient for dairy, vegetables and fish.
Time and again, the government has called upon Bruneian businesses to empower other industries and help in diversification efforts. This will require years of infrastructural development and investment. Due to its untouched rainforests, tourism can be a potential source of income for the Bruneian people.
Brunei Exports Analysis
Brunei’s exports are derived after a careful study of port data, government declarations and local sources. Experts at The Trade Vision leverage extensive resources to monitor each shipment that flows in and out of Brunei.
Brunei’s economy is heavily dependent upon its reserves of oil and natural gas. The revenue earned from the export of oil and other hydrocarbons has consolidated Brunei’s economy. Most trade happens with other large economies in the Asia-Pacific region.
Brunei’s Top Export Commodities
1. Petroleum Gas ($2.38 billion),
2. Refined Petroleum ($1.78 billion),
3. Crude Petroleum ($1.47 billion),
4. Cyclic Hydrocarbons ($959 million)
5. Coal Tar Oil ($163 million)
Brunei’s Leading Export Nation
1. Japan ($1.6 billion),
2. China ($1.23 billion),
3. Singapore ($1.13 billion),
4. Australia ($839 million)
5. Malaysia ($487 million)
Contact The Trade Vision to access an exhaustive list of Brunei’s export data, complete with shipment details, size and frequency.
Brunei Import Analysis
When considered in value terms, top imports arrive in Brunei for use as raw materials for the massive oil processing industry. Since manufacturing is limited in the nation, cars are also among the top imported items. Agricultural imports are also necessitated by Brunei’s limited farmland. Rice, bread, milk and animal feed are among the top agricultural imports.
Brunei’s Top Import Commodities
1. Crude Petroleum ($1.31 billion)
2. Refined Petroleum ($343 million)
3. Cars ($248 million)
4. Valves ($149 million)
5. Gas Turbines ($131 million)
Brunei’s Leading Import Nations
1. Singapore ($843 million)
2. Malaysia ($809 million)
3. China ($542 million)
4. Kazakhstan ($346 million)
5. United Kingdom ($221 million)
For exporters wishing to trade in Brunei, it is imperative to track the merchandise flows and shipment sizes. Agricultural traders must look to fill Brunei’s increasing demand for foodstuffs. The Trade Vision gives you access to vast repositories of the latest Brunei Import Data.
Brunei’s Youth: The Way Forward
The nation has a young and vibrant population that is ready to help the government in its beyond oil strategy. Tourism can be one of the key sectors to employ young people and diversify the economy. There is also the possibility of starting a financial sector along the lines of neighbours Singapore and Malaysia.
The Trade Vision is an international trade research company. We provide you with actionable analytics that steer clear of the noise. Contact us now at mywishplan@thetradevision.com or call +1(307)7573116, to get started.
Download The Trade Vision Mobile App to access data on the go.

Ecuador Import and Export Analysis
26 May, 2022
0
It is nearly impossible for a Latin American country to not be involved in extensive trade with the United States and its enormous consumer market. Ecuador is no exception. Located snugly between Colombia and Peru, Ecuador has a 1398-mile-long coastline. Most export goods produced in Ecuador are meant for the American consumer market. Agricultural items such as bananas, plantains and seafoods are the main exports to the United States. North America is a major market for Ecuadorian agricultural produce.
Trade between the US and Ecuador is also helped by the latter’s adoption of the United States Dollar (USD) as its official currency. Ecuador suffered a massive financial crisis in the 1990s, culminating only in the year 2000 when the government adopted the USD as its official currency. By the time the switch happened, the older Ecuadorian currency, the Sucre, had reached a value of 25, 000 per USD. The switch helped large industrial sectors such as finance, oil, transportation, telecom and tourism. Although, small traders of agricultural produce suffered due to loss of price control.
Bananas and Other Exports
Ecuador was ranked as the largest exporter of Bananas in 2020. The nation corners about 30% of banana export production. In many parts of Ecuador, Banana plantations go on for as far as the eyes can see. However, the Russia-Ukraine war has caused massive problems for Banana traders in Ecuador. The warring nations account for about 20% of Ecuador’s Banana exports. Due to international sanctions, banana shipments are rotting on Ecuadorian shores. Businesses have lost revenue, workers have lost jobs. The situation is extremely worrisome. Agricultural importers from the US, Western Europe and South America must research if it would be viable to absorb buyer-less Ecuadorian banana exports. A good place to start and finish your in-depth research would be with The Trade Vision’s expertly crafted Ecuador Export datasets.
Ecuador’s top export commodities are -
• Crude Oil ($4.94 billion)
• Bananas ($3.83 billion)
• Crustaceans ($3.83 billion)
• Processed Fish ($1.19 billion)
• Cut Flowers ($835 million)
Leading export partners are -
• United States ($4.8 billion)
• China ($2.94 billion)
• Panama ($2.43 billion)
• Russia ($929 million)
• Chile ($823 million)
Ecuador Import Analysis
Developing markets around the world are great places for import and export trade. Ecuador can prove to be just the opportunity that you need to expand your operations. To begin exporting your goods to Ecuador, you need to access the most accurate Ecuador import data. Be it any product, The Trade Vision’s experts have accumulated the most extensive database of import export data from around the world.
Meanwhile, here are Ecuador’s top import commodities-
• Refined Petroleum ($1.64 billion)
• Coal Tar Oil ($811 million)
• Broadcasting Equipment ($546 million)
• Packaged Medicaments ($518 million)
• Cars ($484 million)
The leading import partners are -
• United States ($4.23 billion)
• China ($3.8 billion)
• Colombia ($1.51 billion)
• Peru ($645 million)
• Brazil ($614 million)
The Ecuadorian development story came to a standstill when oil prices started plummeting in 2014. Experts have said that despite deficit, the government kept spending incessantly for electoral gains. After an IMF bailout, expenditure cuts, the Covid-19 pandemic and the election of a new government, Ecuador now has to deal with export losses caused by the Russia-Ukraine crisis. The government must look to improve the fiscal structure and invest in industrial development to alleviate Ecuadorian traders’ worries.
The Trade Vision is an international trade research company. We provide you with actionable analytics that steer clear of the noise. Contact us now at mywishplan@thetradevision.com or call +1(307)7573116, to get started.
Download The Trade Vision Mobile App to access data on the go.

Tanzania Import Export Analysis
26 May, 2022
0
Bullock carts traverse rustic roads only a few miles away from SUVs humming along on the highways. Seaports and island resorts built for tourists stand alongside shanties and towns. Vast wildlife reserves complement marine animals thriving in the Indian ocean.
This is the complex and beautiful nation of Tanzania. It is a land of natural wonders and bounteous mineral resources. The long coastline is home to some of the finest beaches in the world. Tourists flock to destinations such as Zanzibar and Serengeti National Park, among others. Tanzania import export trade flourishes through the port of Dar es Salaam.
A wide network of national parks and the great Mount Kilimanjaro (Africa’s highest peak) complete the traveller’s dream of exploring Africa in its truest state. Unsurprisingly, tourism makes up most of Tanzania’s revenue. Before Covid-19 halted international travel, the Tanzanian service industry accounted for about 40% of the nation’s GDP. The government has been lauded for fast-tracking post-COVID economic recovery and being on track to achieve 5 million visitors by 2025.
Tanzania Export Analysis
Tanzania’s export economy is heavily dependent upon precious and semi-precious metals. In fact, the mining industry is responsible for half of Tanzania’s exports. Tanzania’s most valuable trade relations arise from the export of copper to India ($260 million) and Gold to the United Arab Emirates ($806 million). Diamonds are also extensively mined in Tanzania.
The nation has entered into trade agreements, investment deals and cooperation summits with several other countries. Indian, European and Chinese importers and exporters can benefit greatly from trade with Tanzania. The agribusiness industry in Tanzania is a sleeping giant that could improve domestic food security. Experts say that there is enough agribusiness potential in Tanzania to supplement exports too. The Trade Vision’s vast bank of data is quintessential to deeply understand Tanzania’s export and import dynamics.
Tanzania’s top export commodities are-
• Gold ($2.36 billion)
• Coconuts, Brazil Nuts, and Cashews ($386 million)
• Raw Copper ($345 million)
• Precious Metal Ore ($343 million)
• Dried Legumes ($208 million)
Let us examine the leading export partner nations-
• India ($891 million)
• United Arab Emirates ($866 million)
• Switzerland ($796 million)
• Uganda ($734 million)
• China ($388 million)
Tanzania Import Analysis
The nation’s import data is characterized by its developing nature. Tanzania imports most basic goods from China, the top commodities include footwear, apparels, electronics and rubber tires. The Trade Vision is the place to be if you seek carefully devised datasets and accurate market intelligence reports of Tanzania’s import data.
Here are Tanzania’s top import commodities-
• Refined Copper ($1.55 billion)
• Refined Petroleum ($730 million)
• Packaged Medicaments ($368 million)
• Palm Oil ($302 million)
• Wheat ($219 million)
The leading import partners are-
• China ($4.17 billion)
• Democratic Republic of the Congo ($1.67 billion)
• India ($1.41 billion)
• United Arab Emirates ($788 million)
• South Africa ($336 million)
Eastern African Cooperation and Tanzania
The nations that make up East Africa are some of the poorest in the world. Decades of economic mismanagement, conflicts and global neglect have all contributed to exploitation in the region. Tanzania’s neighbors such as Kenya, Uganda, Democratic Republic of Congo and others must look to coordinate their economic policies and make the most from cohesive trade. International development agencies must turn their attention to Eastern Africa’s development. The mineral-rich lands of the region promise not only trade opportunities for all but are also a beacon of hope for the worst poverty-stricken communities in the world.
The Trade Vision is an international trade research company. We provide you with actionable analytics that steer clear of the noise. Contact us now at mywishplan@thetradevision.com or call +1(307)7573116, to get started.
Download The Trade Vision Mobile App to access data on the go.

Uganda Import and Export Analysis
24 May, 2022
0
Described as a ‘fairy-tale’ by Winston Churchill, Uganda is an Eastern African nation with diverse natural landscapes and various local ethnicities. There are massive volcanic mountains, rainforests teeming with wildlife, swamps and fertile agricultural land. Bugisu coffee from Uganda is exported the world over. Coffee fanatics love the fruity and strong flavours of the traditional Eastern African brew.
Kampala, the capital city is the centre of Ugandan cultural exchange and economic activity. The city serves as the headquarters of several export firms that deal in coffee, sugar, tobacco and tea.
Jinja is another important industrial city. It lies on the shores of Lake Victoria, a tropical lake that also serves as a trading route between Uganda, Tanzania and Kenya. It has been reported that a revenue of $60 billion could be generated with the complete development of ports along the lake’s shores. Currently, the trilateral trade on Lake Victoria is about a tenth ($6 billion) of its potential.
Uganda Export Analysis
Uganda’s export data is compiled by The Trade Vision using laboriously churned port data, shipping companies data, declarations from government agencies and established trade associations. Our market intelligence services can help you understand the nature, frequency and size of shipments that flow in and out of Uganda. The export data is especially crucial for coffee importers, precious stones merchants and agricultural traders across the world.
Uganda’s total export value was recorded at $5.87 billion in 2020.
The top export commodities are-
• Gold and Other Precious Stones ($3.47 billion)
• Coffee($539 million)
• Cocoa Beans ($101 million)
• Raw Sugar ($71.2 million)
• Tea ($69 million)
Uganda’s top export partners are-
• United Arab Emirates ($3.5 billion)
• Kenya ($401 million)
• South Sudan ($357 million)
• Democratic Republic of Congo ($265 million)
• Italy ($144 million)
Uganda Import Analysis
Importing to Uganda can be a challenging process. Being a landlocked country, Uganda has to rely on ports in Mombasa, Kenya and Dar es Salaam, Tanzania for the delivery and receipt of its shipments. For those wishing to export to Uganda, it becomes all the more important to access the nation’s import data.
Uganda’s imports are characterized by its developing economy. The proliferation of a middle class in metropolises leads to the import of commodities central to Uganda’s industrial growth.
The primary import commodities are-
• Gold ($1.97 billion)
• Refined Petroleum ($651 million)
• Palm Oil ($391 million)
• Pharmaceuticals ($309 million)
• Trucks and Mechanical Equipment ($128 million)
The leading import partners are-
• China ($1.18 billion)
• Kenya ($940 million)
• India ($797 million)
• Tanzania ($734 million)
• United Arab Emirates ($561 million)
Uganda’s maritime trade ambitions will truly be realised by the development of Lake Victoria. The country is bordered by Tanzania, South Sudan, Kenya, Rwanda, and the Democratic Republic of Congo(DRC). Cooperation between these Eastern African nations is key to development in Uganda and the region. The Ugandan government must look to better basic facilities and promote industrial development to ensure growth.
The Trade Vision is an international trade research company. We provide you with actionable analytics that helps you steer clear of the noise. Contact us now at mywishplan@thetradevision.com or call +1(307)7573116, to get started.
Download The Trade Vision Mobile App to access data on the go.
China’s Stringent Lockdown and Global Import Export
23 May, 2022
0
Successive waves of the COVID19 pandemic have again caused detriment to global import export trade. The industry, already struggling with the Russia Ukraine war and previous lockdowns, is now facing acute troubles. The harsh lockdowns in major Chinese trading hubs such as Shanghai and other cities are particularly concerning. Industrial production is concentrated in these areas and lockdowns are severely hurting business prospects.
Recently released Chinese import and export data suggests sluggish export growth and stagnant imports for the past year. While economists expected worse, the stagnant imports throw light upon more pressing issues. Not only is local demand subdued, but global supply chains are also grappling with shortages. Chinese manufacturing units have been shut and have recorded their worst months since February 2020.
World Supply Chains Under Duress
Besides lockdown, China’s domestic trade troubles also arise from the Russia-Ukraine war. Russian Exports to China have increased by over 50%, primarily due to inflation in the cost of gas, crude oil and other commodities. This is coupled with a disturbing drop in export volume to Russia.
Similarly, trade with Hong Kong, the United Kingdom, Germany and Japan have also suffered. While Chinese exports to the United States have improved. Apparel manufacturing in the Vietnam export and import industry has also suffered immensely.
China is referred to as the manufacturing hub of the world. It is expected that disruptions caused due to stringent lockdowns will exacerbate global inflation. Central banks in Europe, Asia, the Americas and Africa are expected to or have already announced lending rate hikes. Tech giants such as Apple and Tesla are also under pressure.
Shipping Woes in Shanghai
Shanghai is one of the busiest port cities in the world. In 2020 alone, the Shanghai International Port’s trade volume was more than $3 Billion, down from $5 Billion in 2019. Currently, economic activity has come to a near halt as Shanghai faces a stringent lockdown. Logistical delays and other operational impediments arising from Shanghai’s lockdown have strained manufacturing processes worldwide.
China’s Shifting Demand
Importers and exporters around the world have started looking for alternatives to plug the supply chain gap. Primarily, exporters from India and South East Asia are expected to fulfil the lost volume of raw materials from China. In case of a shift in product sourcing trends, Chinese traders are worried about their business prospects.
Stimulus Pledged and Lockdown Tightened
The Chinese Communist Party has pledged to announce an economic stimulus package that will boost local demand. This is in continuance with a strict lockdown in major cities. The Chinese government is adamant about a zero-COVID policy. This stance is causing great stress to the Chinese import-export community and the general public. Employees are afraid of losing jobs; businesspersons are afraid of losing revenue, and those on the fringes are pining for their mere survival. The global community is closely following COVID-related developments in China. Needless to say, everyone hopes that the lockdown is eased soon.
The Trade Vision is an international trade research company.We provide you with actionable analytics that steer clear of the noise.
Contact us now at mywishplan@thetradevision.com or call +1(307)7573116, to get started.
Download The Trade Vision Mobile App to access data on the go.
Enquiry
0